Taskon – Task Management Platform
Improving onboarding, navigation, and reporting for seamless task management.
- Industry: SaaS, Task Management
- Role: Product Designer
- Duration: 3 weeks
- Deliverables: UX research, wireframes, high-fidelity prototype and style guide.
The Project (fictitious redesign)
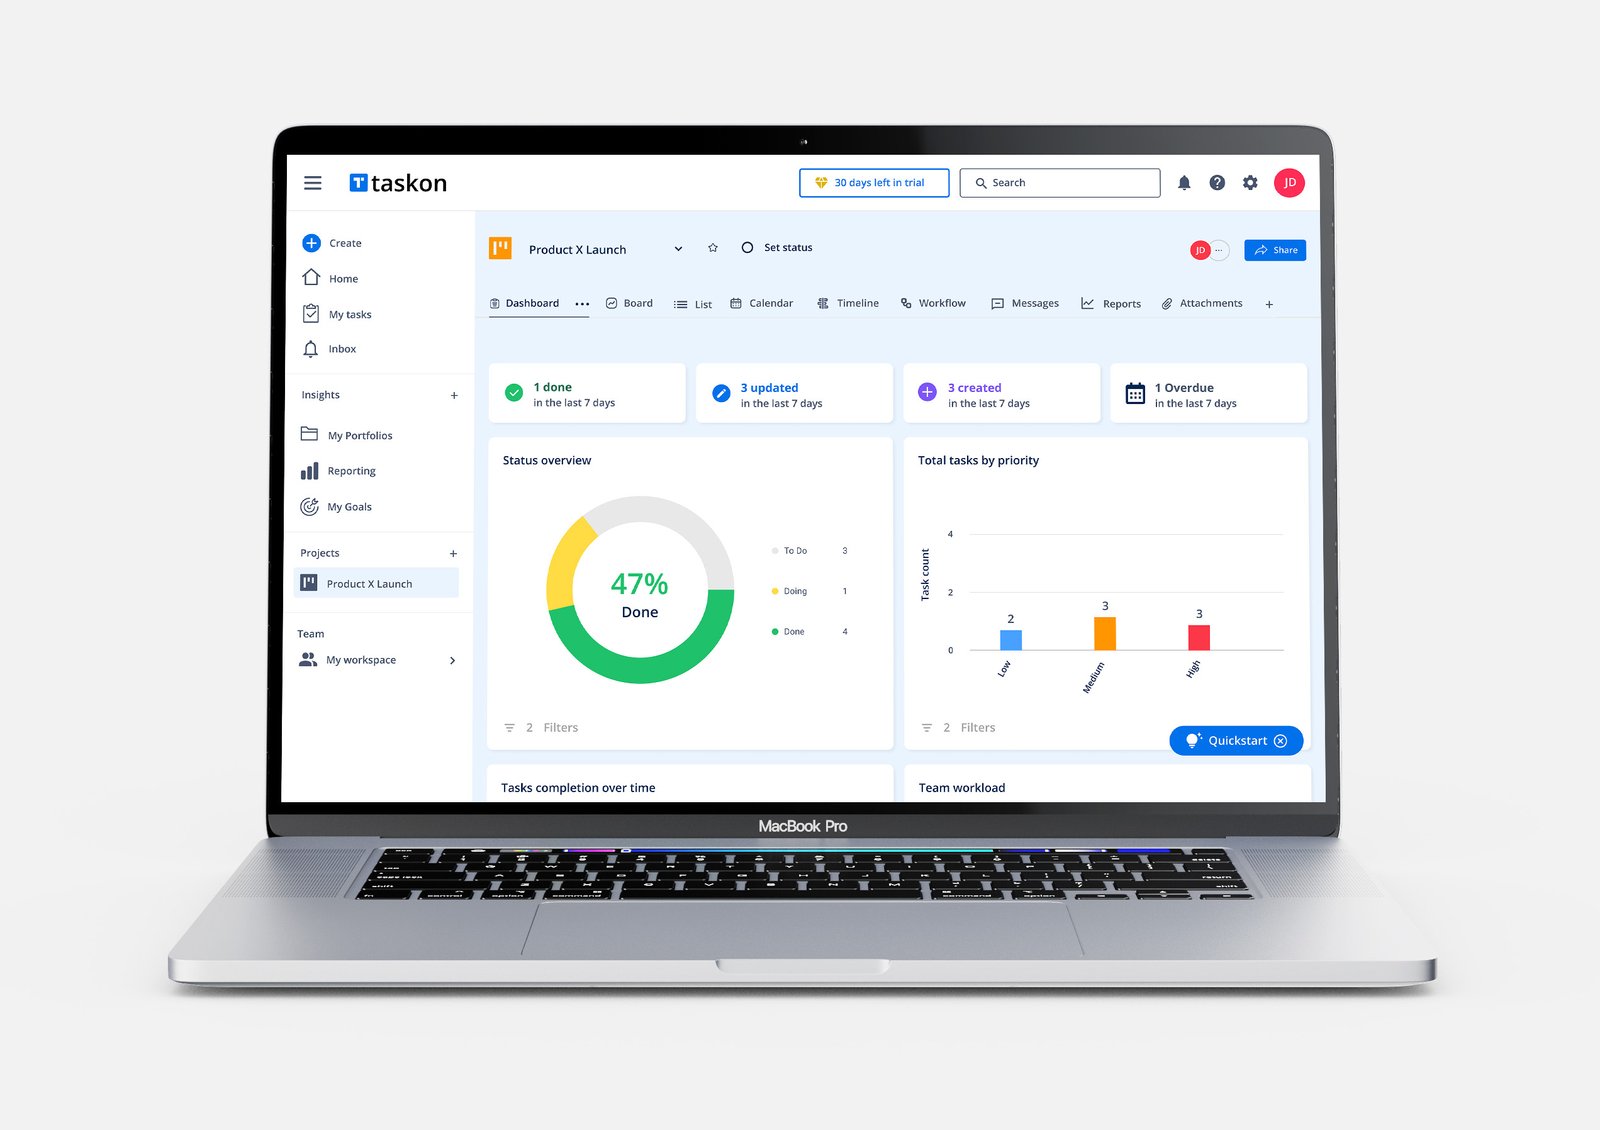
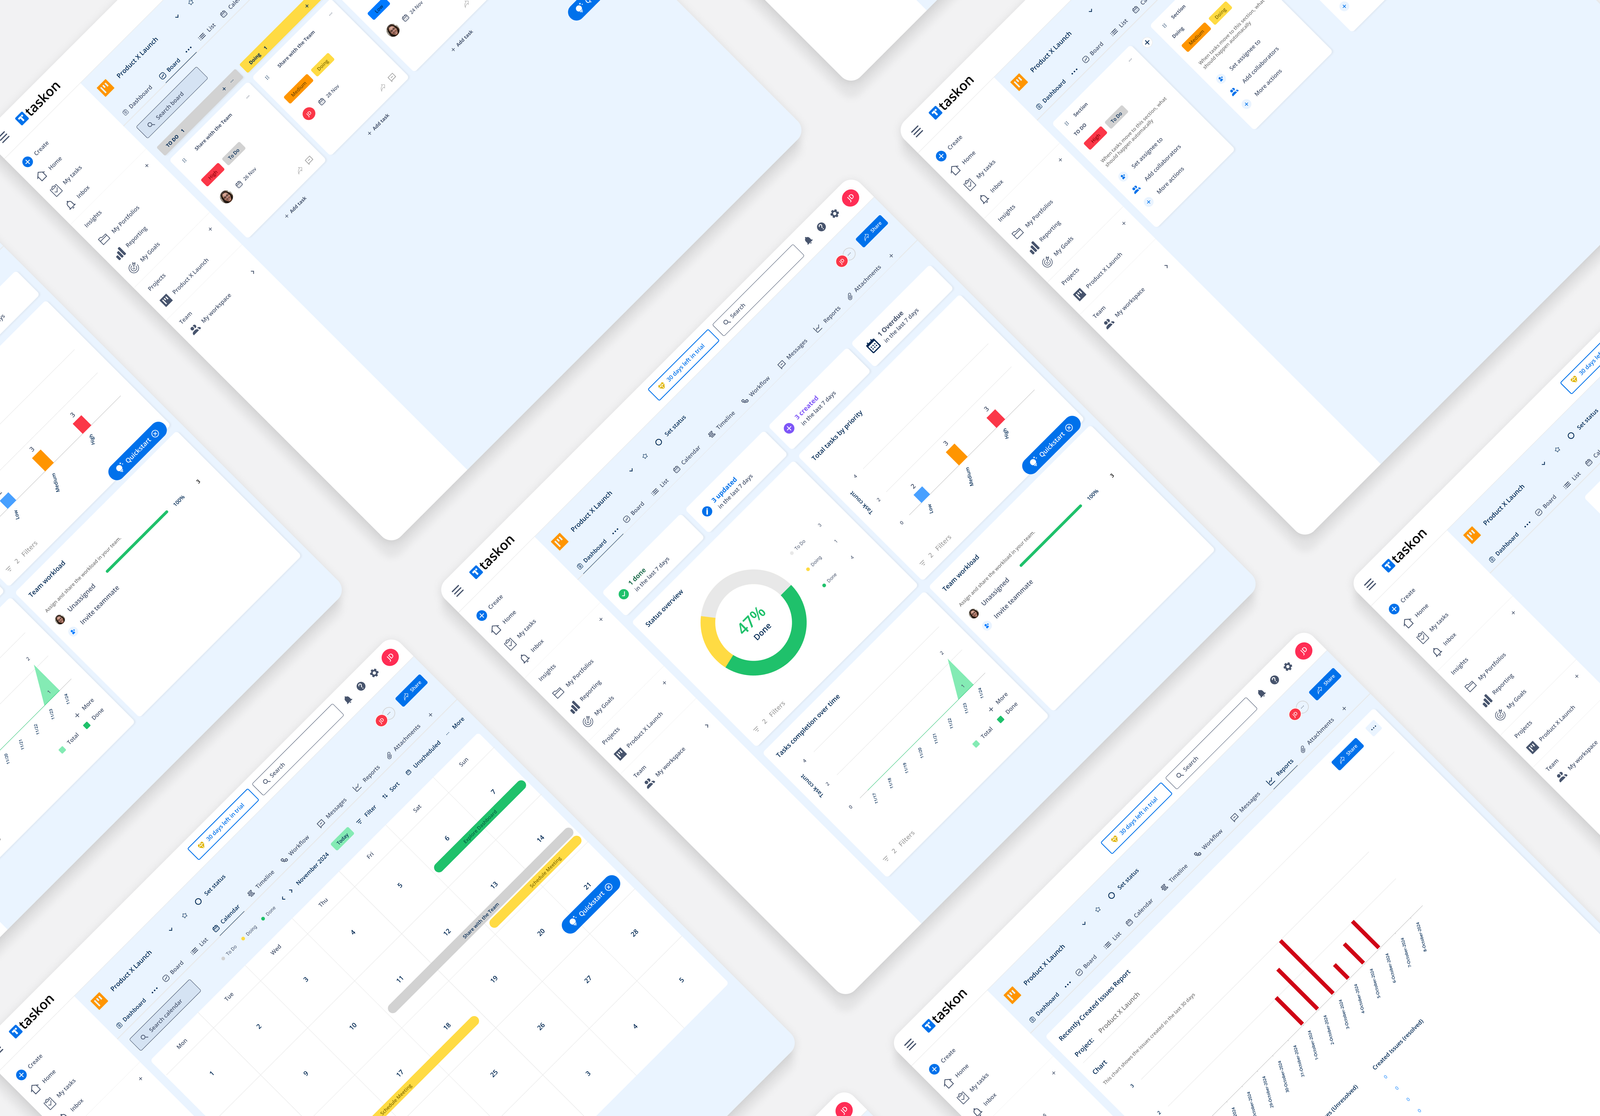
Taskon is a SaaS platform aimed at small and medium-sized businesses, designed to manage tasks and organize team workflows. The platform allows users to create, delegate, track tasks, view progress through dashboards (Kanban boards, calendars), collaborate with team members in real-time (comments and file attachments within functions) and generate reports on productivity and deadlines.
The Problem
- Users report difficulties with:
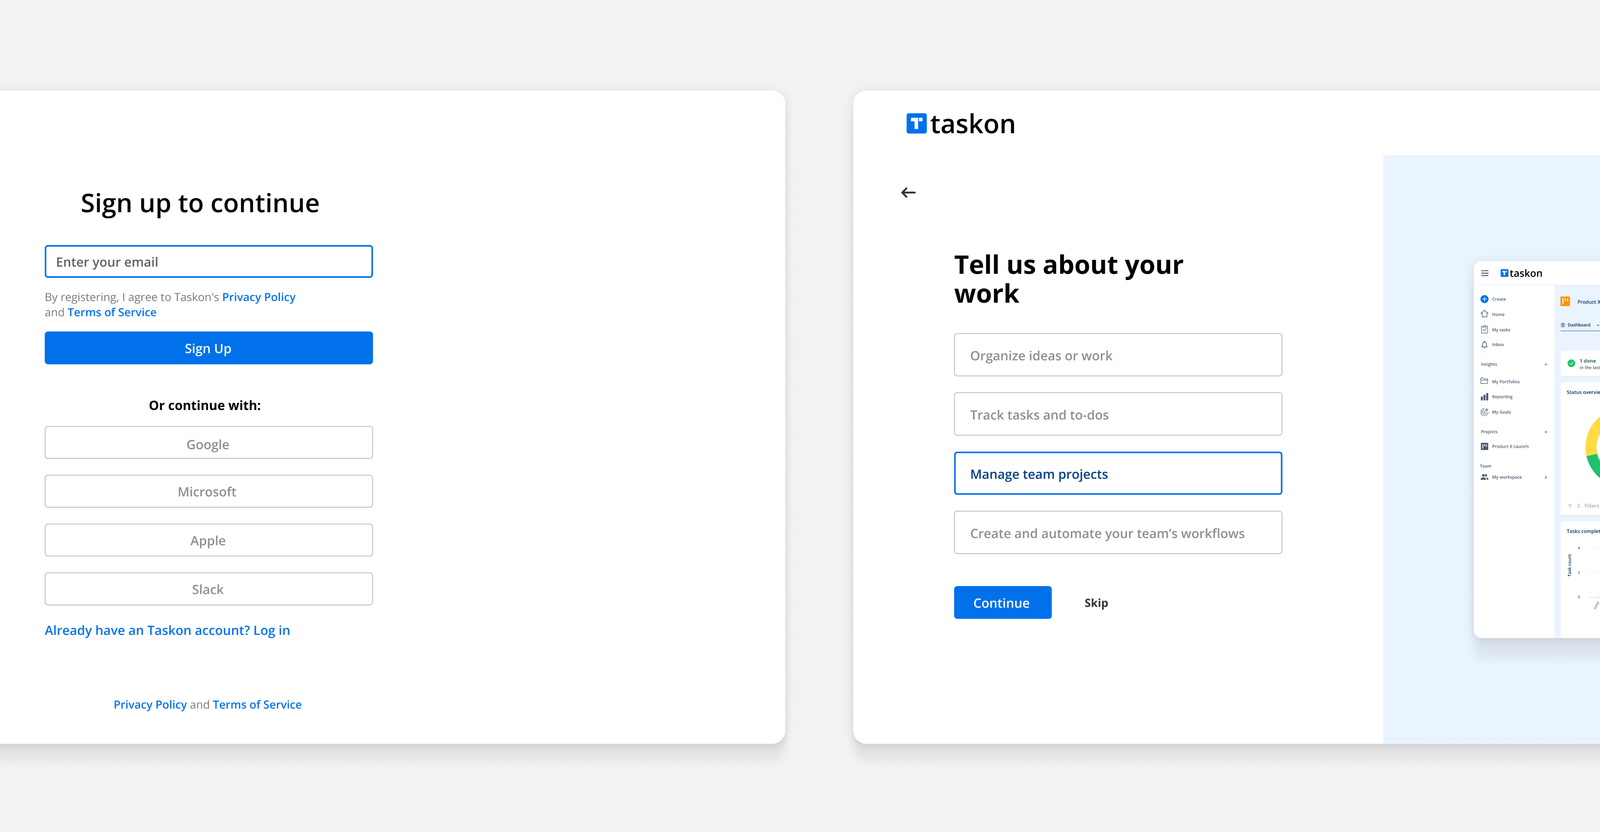
- Initial Setup: The onboarding process is confusing and time-consuming.
- Task Navigation: The navigation options are disorganized, making it hard to locate specific tasks.
- Understanding reports: Available metrics are poorly explained and unintuitive.
These issues lead to:
- Low retention rates: Many users abandon the platform after the free trial period.
- High frustration levels: Negative feedback on the platform’s learning curve.
Project Goals:
Redesign the user experience to:
- Improve onboarding, ensuring new users can set up their accounts in under 5 minutes.
- Make navigation more intuitive, reducing task search times by 40%.
- Revamp the reporting interface to present data clearly and visually.
Success Metrics:
- Increase trial retention rate from 30% to 50%.
- Reduce the average setup time from 10 minutes to 5 minutes.
- Improve user satisfaction in usability surveys (from 3.5 to 4.5 out of 5).
Product Design Process
RESEARCH PHASE
I – Briefing
We analyzed the project briefing based on goals, business requirements and user challenges
II – Secondary Research
We collected data based on issues faced by SaaS task management platforms.
Reports on SaaS usability:
– Due to onboarding complexity, 50% of users abandon a SaaS platform within the first 7 days.
– Disorganized dashboards are the second most common complaint in productivity tools (35% of users).
User preferences for SaaS tools:
– 70% of users prefer interactive tutorials during the first use.
– 65% find visual reports (charts and diagrams) easier to interpret than text-based lists.
Sources: SaaS Retention and Onboarding Strategies / SaaS Onboarding Optimization
Problem Statement: many Taskon users report that the current onboarding flow has too many unnecessary steps and needs
more clarity on how to use basic features, such as creating and organizing tasks in Kanban boards.
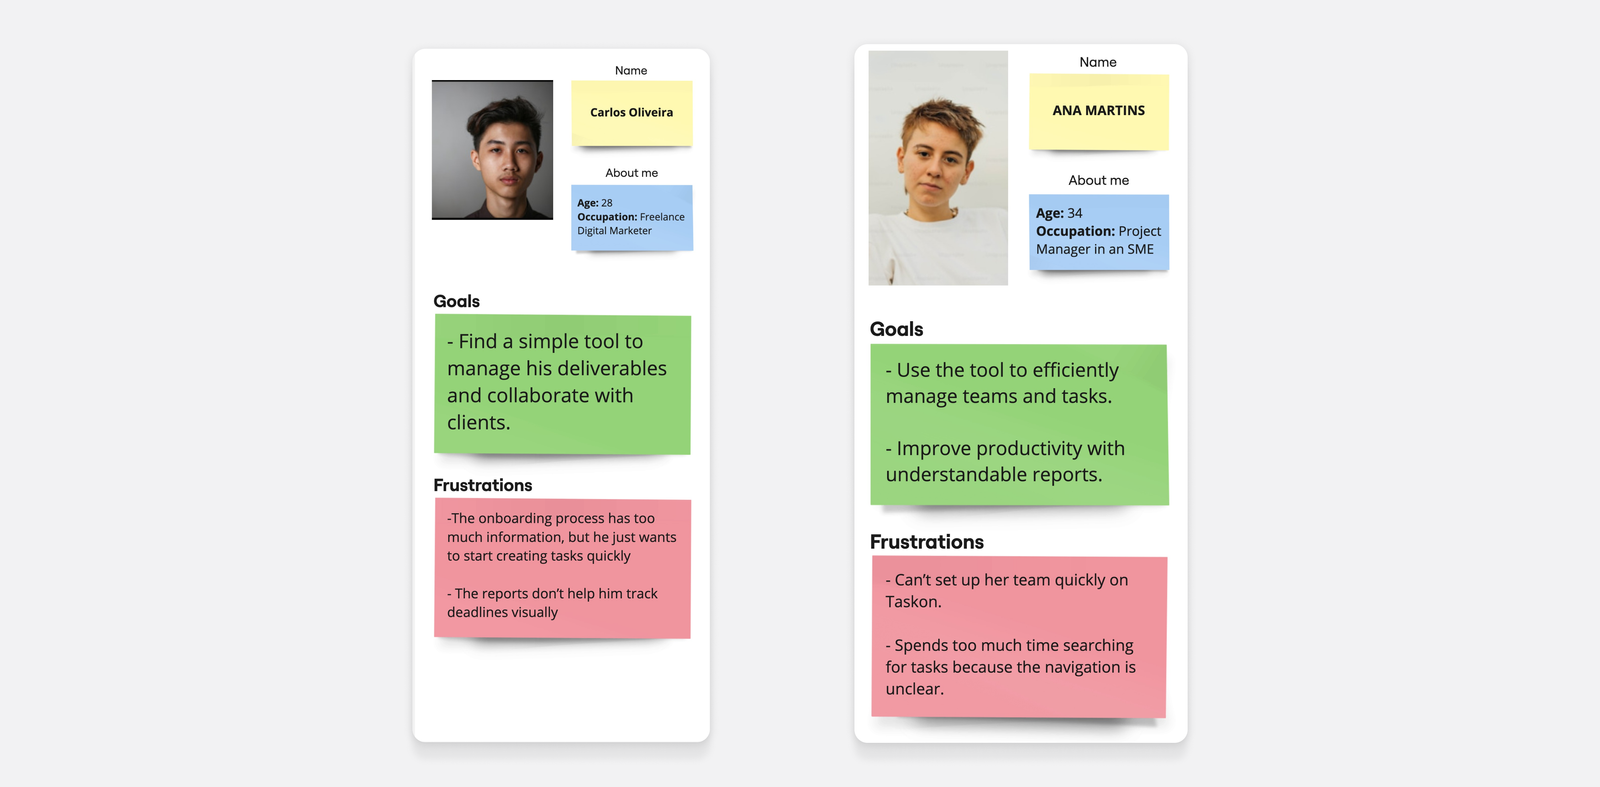
Create Personas
Based on the target audience described in the briefing, we
created two personas to guide the design process:
III – Benchmark
We analyzed three competing tools to identify best practices and gaps to address:
TRELLO:
Strengths: Simple interface with clear menus and drag-and-drop Kanban boards.
Limitations: Basic functionalities can be restrictive for advanced users.
ASANA:
Strengths: Intuitive navigation and flexibility in task management.
Limitations: The initial interface can be intimidating for new users.
ClickUp:
Strengths: Robust features and high customization.
Limitations: Overloaded interface, making the learning curve steep.
IDEATION PHASE
I – User Journey Map
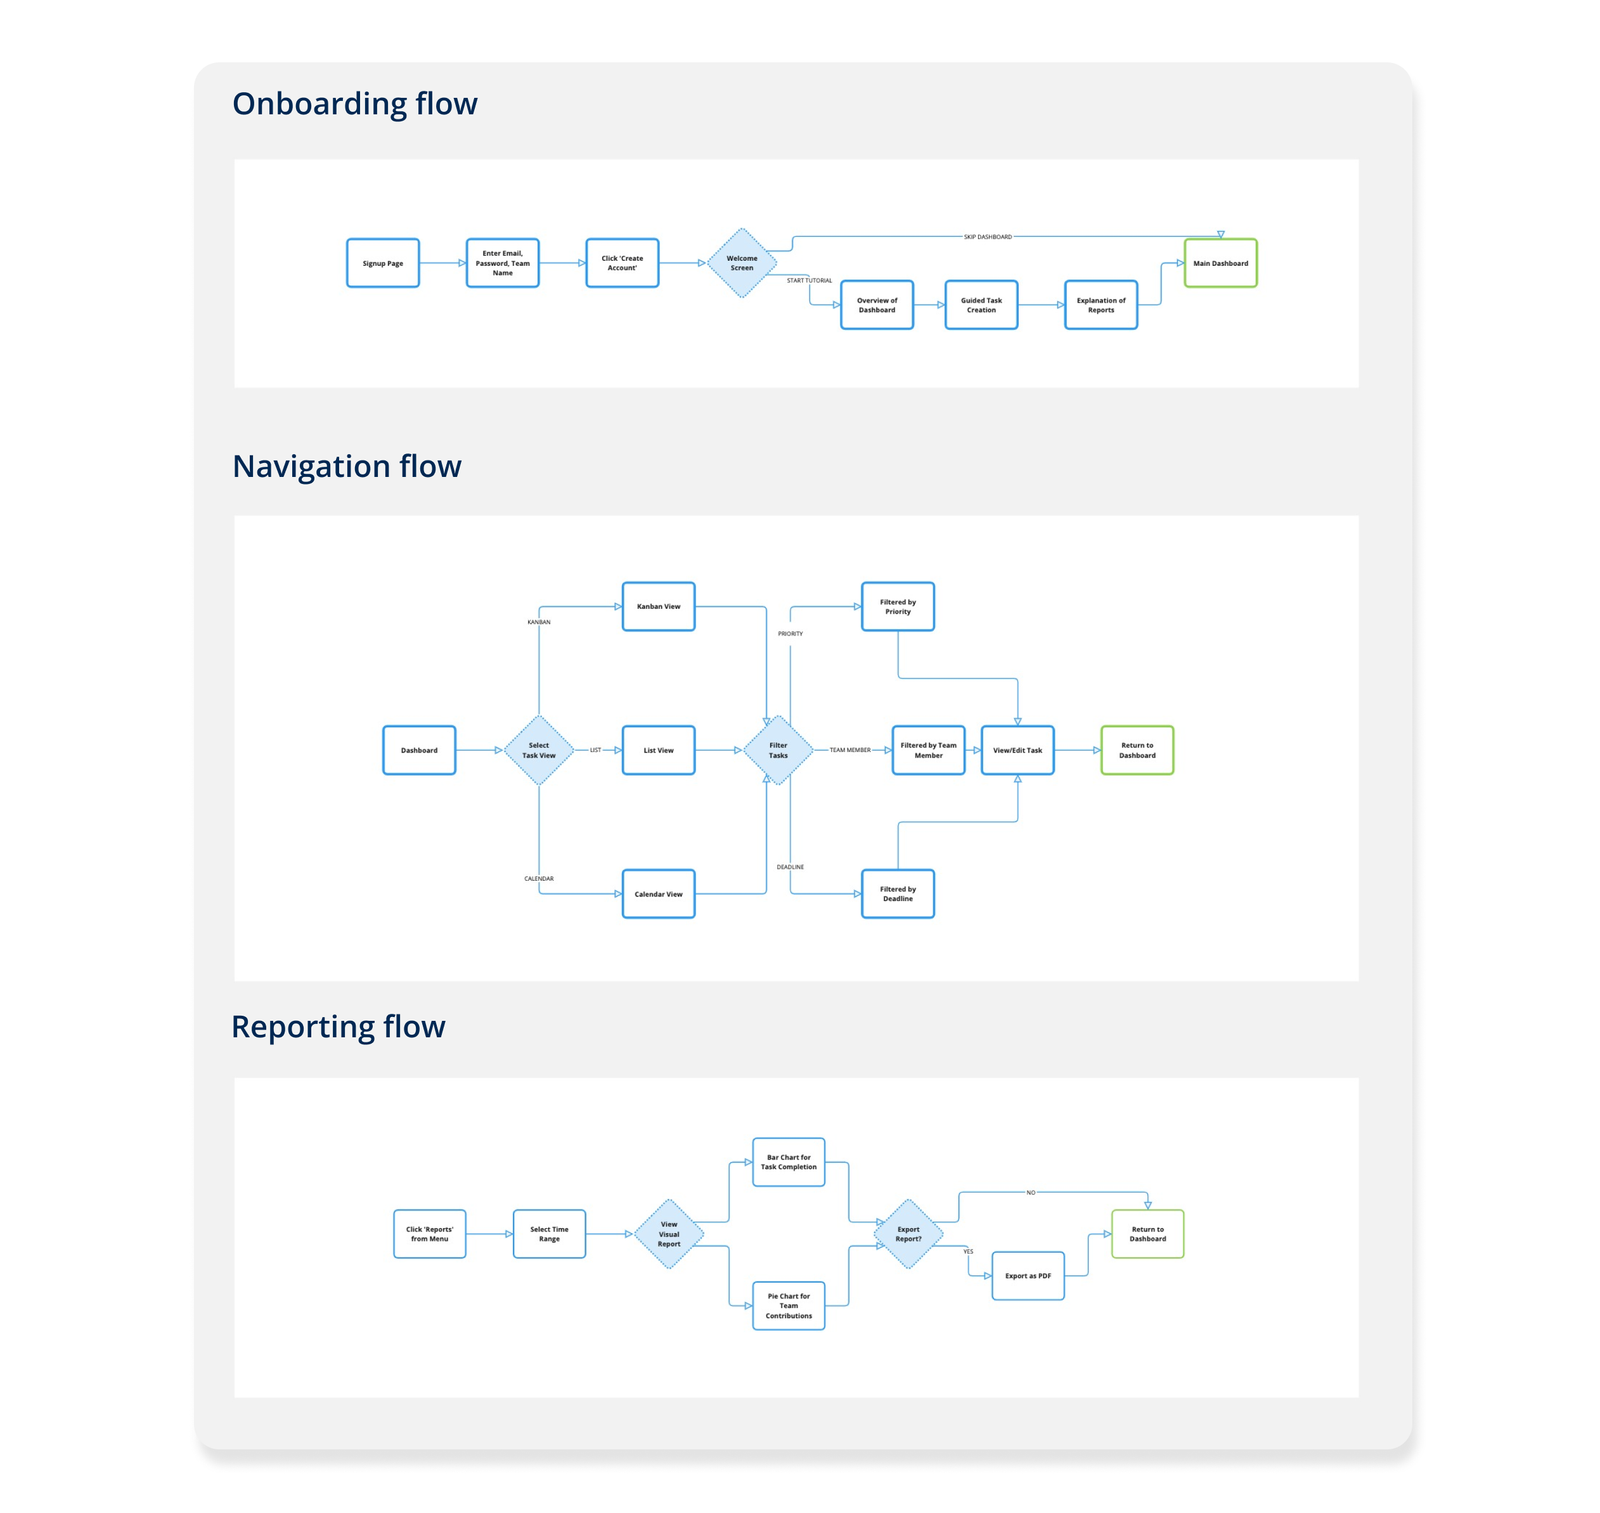
We mapped out the User Flows for Taskon, focusing on three key actions based on the briefing:
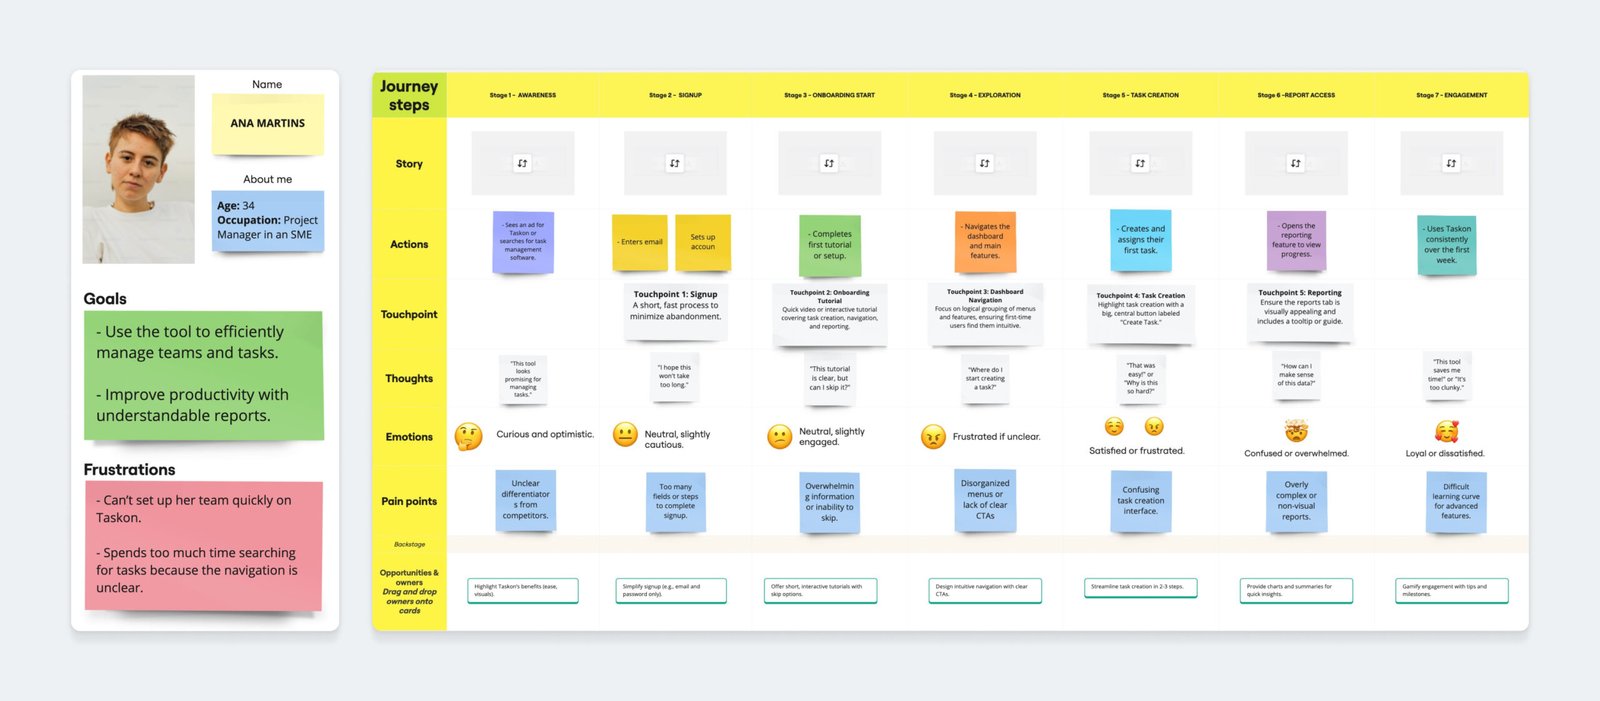
- Onboarding Flow ( success Metric: the user completes onboarding within 5 minutes)
- Navigation Flow ( success Metric: the user locates a task within 10 seconds)
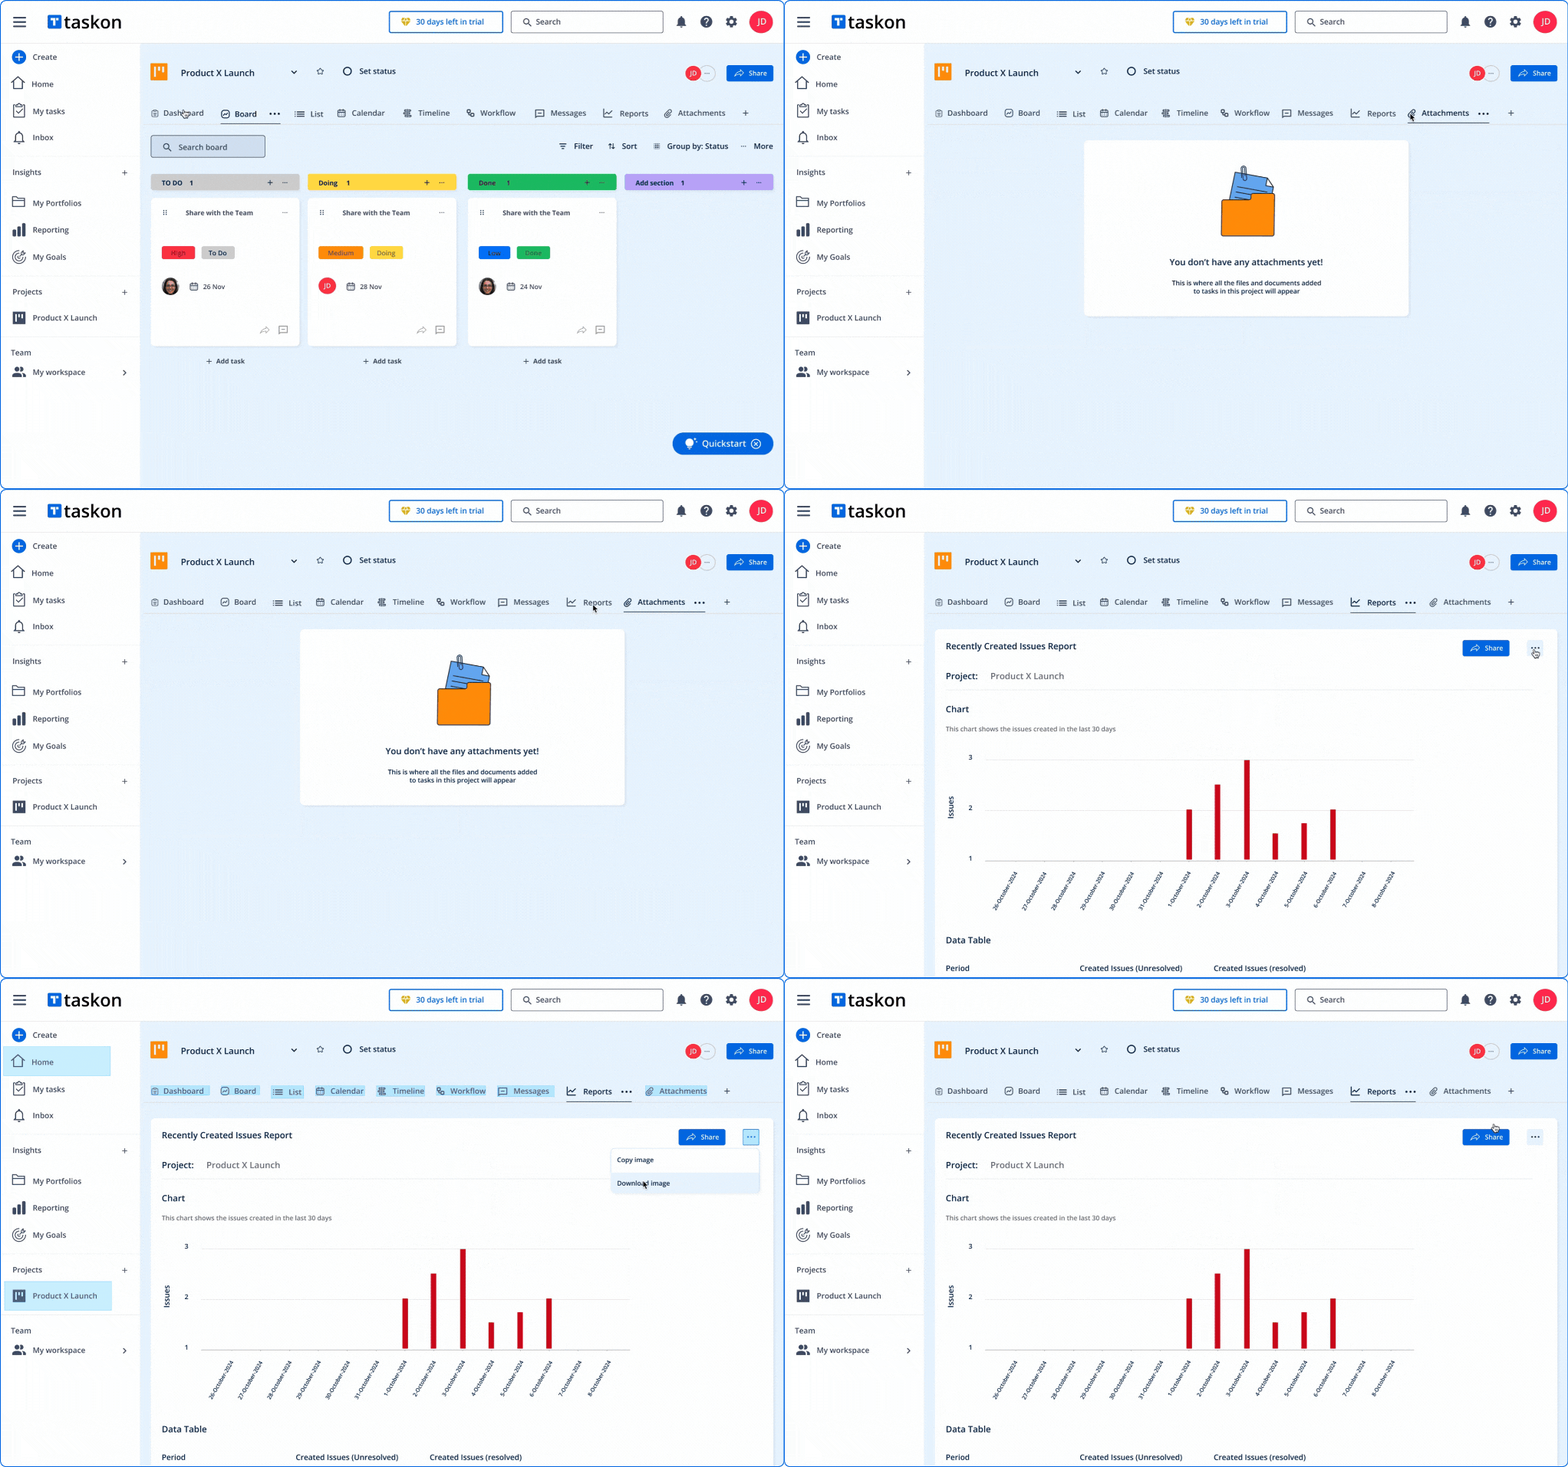
- Reporting Flow (success Metric: the user generates and understands a report in under 2 minutes)
II – Decision Matrix
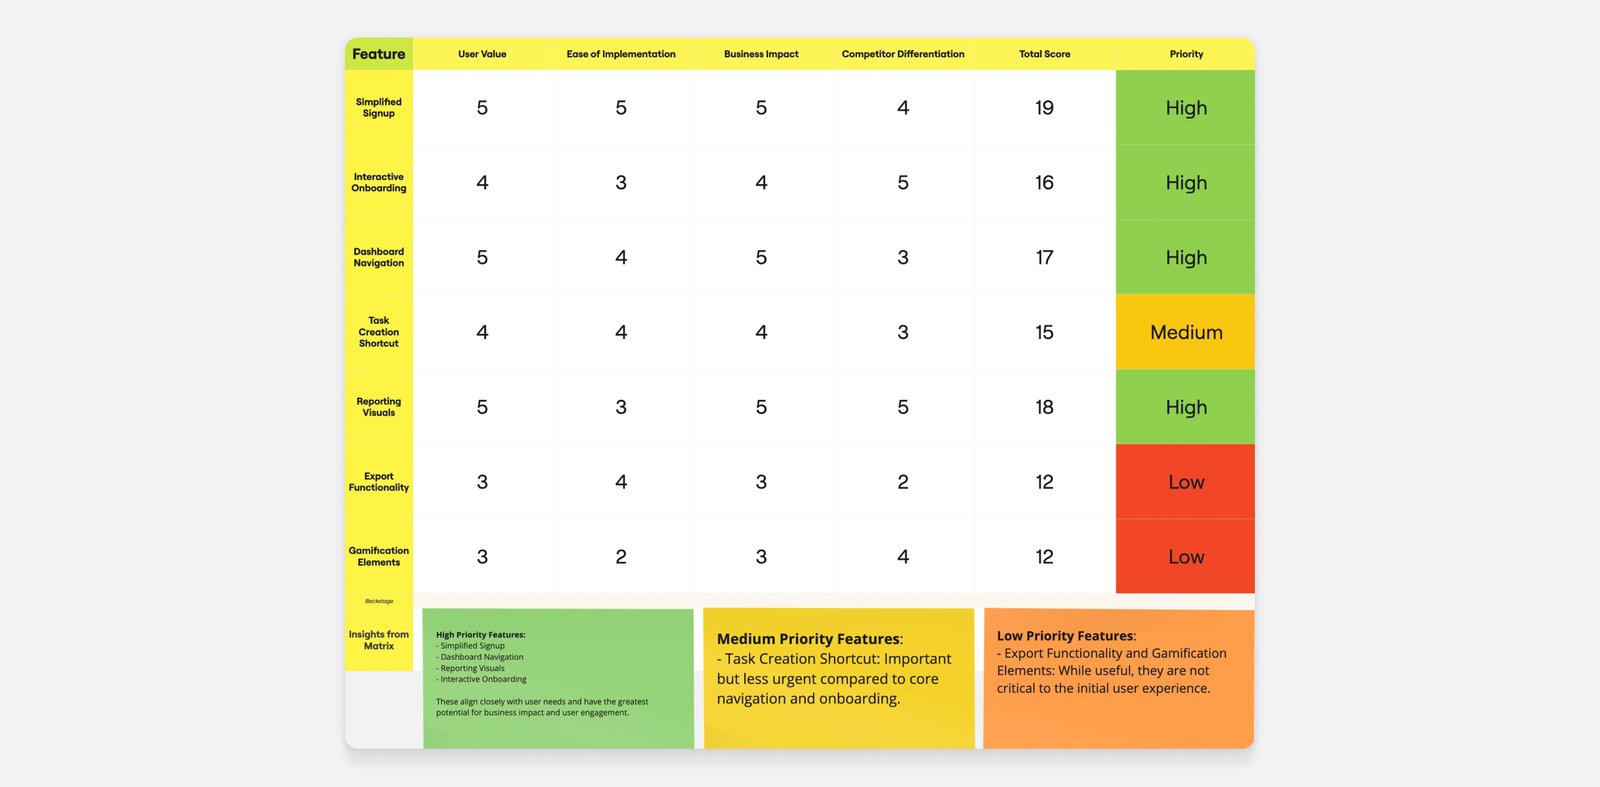
Using the insights from the user journey and flows, we evaluated the features based on key criteria: User Value, Ease of Implementation, Business Impact, and Competitor Differentiation.
Each feature is rated on a scale of 1-5 (1 = Low, 5 = High). The total score helps prioritize features for implementation.
III – Wireframes
IV – The Mood Board
The Mood Board ensures that the product’s visual and emotional aesthetic resonates with the intended user experience, aligns with the user profile, and supports the overall market strategy. During this step, we define the “mood” of the product through a curated collection of visual elements such as images, typography, colors, textures, and keywords.
The goal is to encapsulate the essence of the Taskon brand and product in a way that aligns with its core values, audience needs, and SaaS market expectations. This visual direction lays the foundation for the product’s interface and design elements, ensuring consistency and user connection throughout the experience.
DESIGN PHASE
I – Style Guide
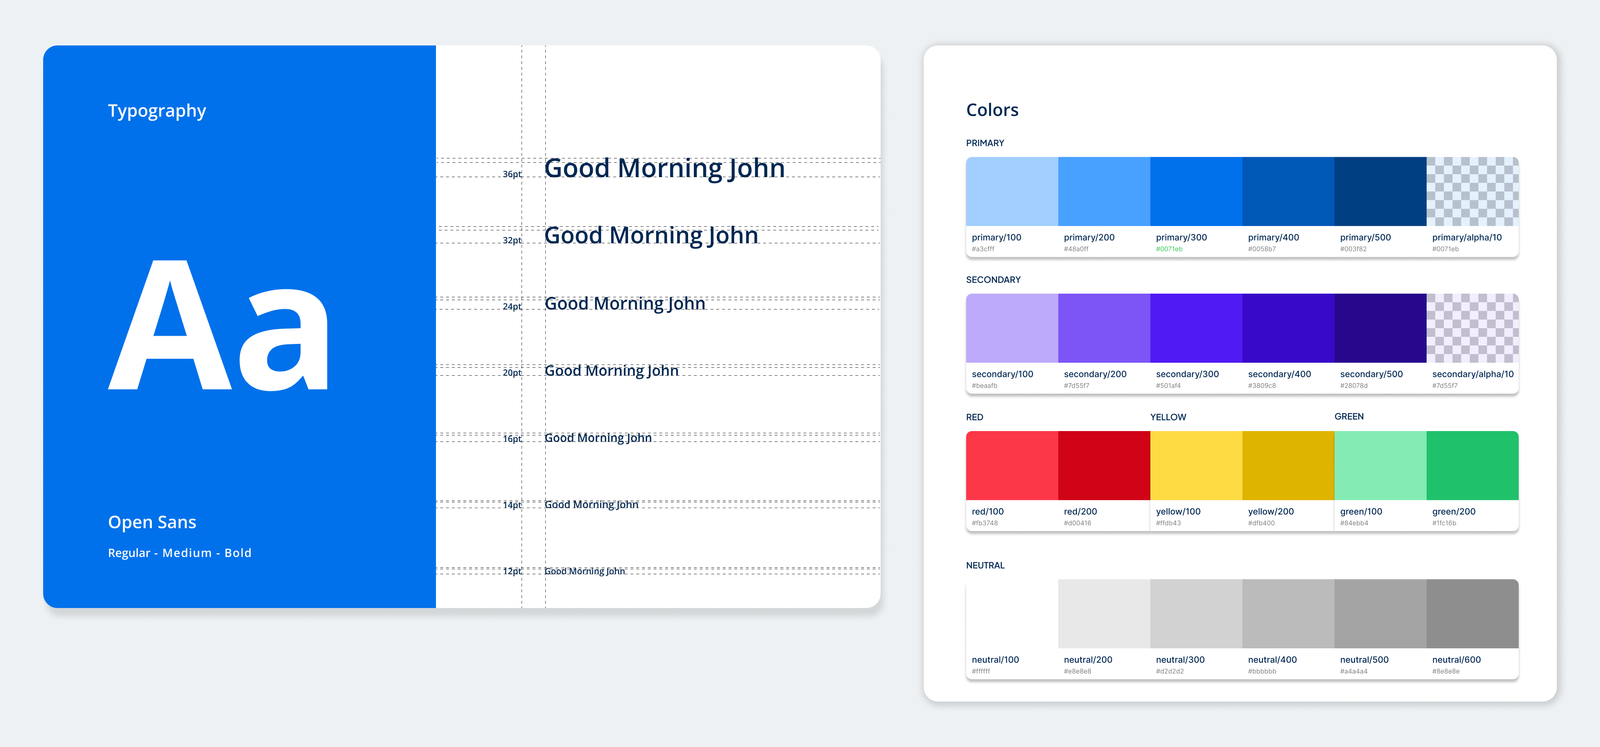
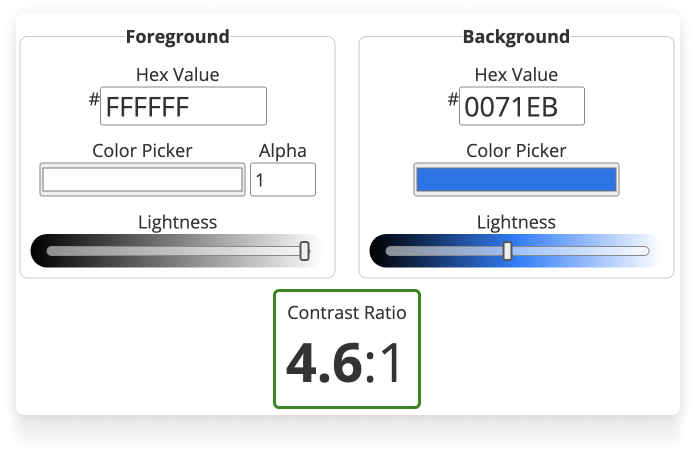
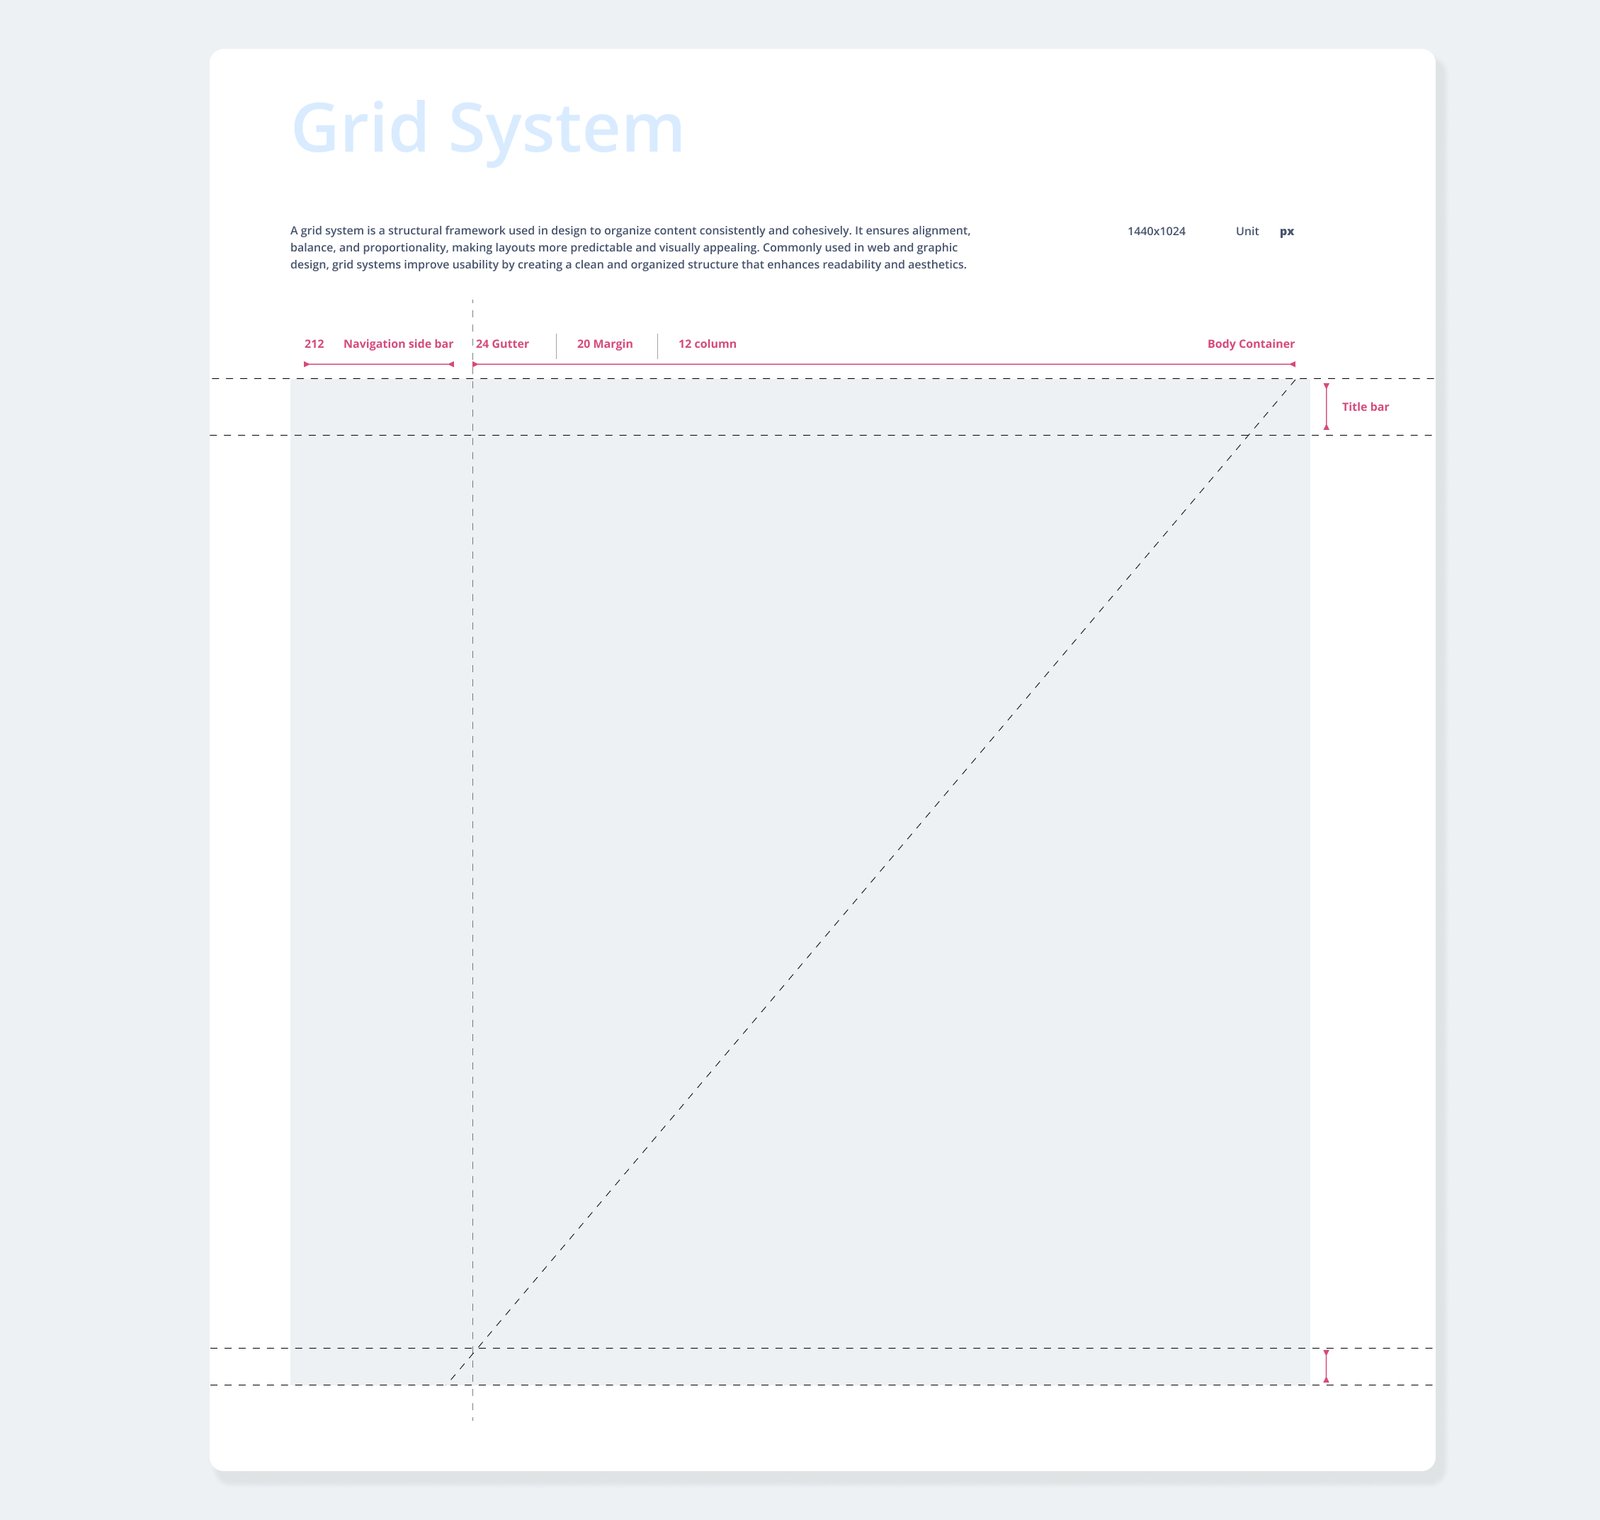
The Style Guide Phase focuses on documenting the visual and functional design standards to ensure consistency across the product. It includes key elements like typography, color palette, iconography, grid systems, and UI components. This phase serves as a reference for developers and designers, fostering alignment with the brand identity and creating a cohesive user experience throughout the product.
![]()
II – Graphic User Interface (GUI)
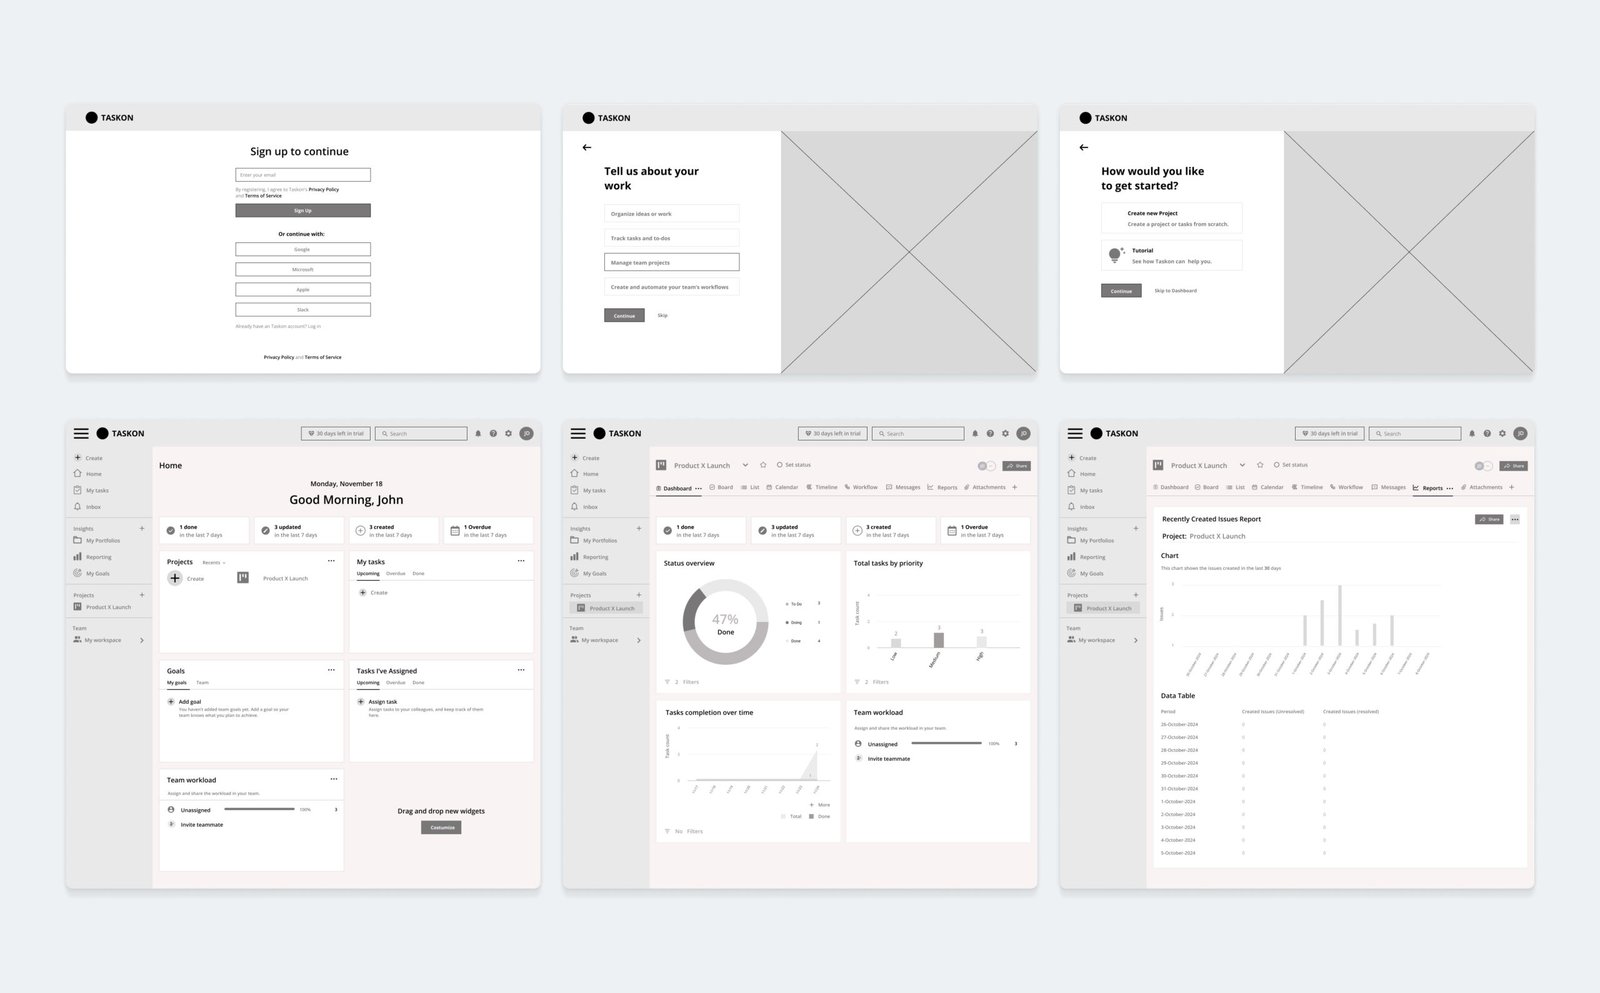
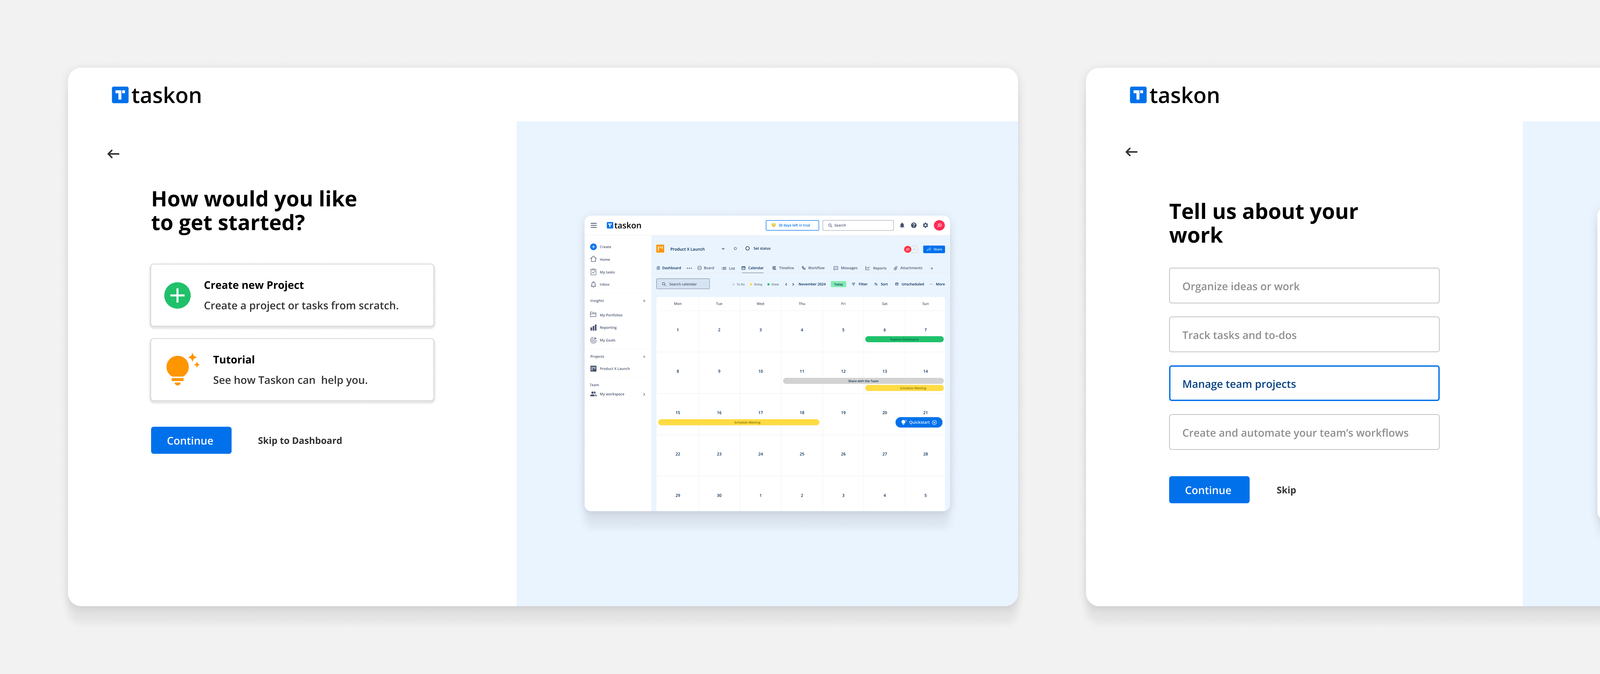
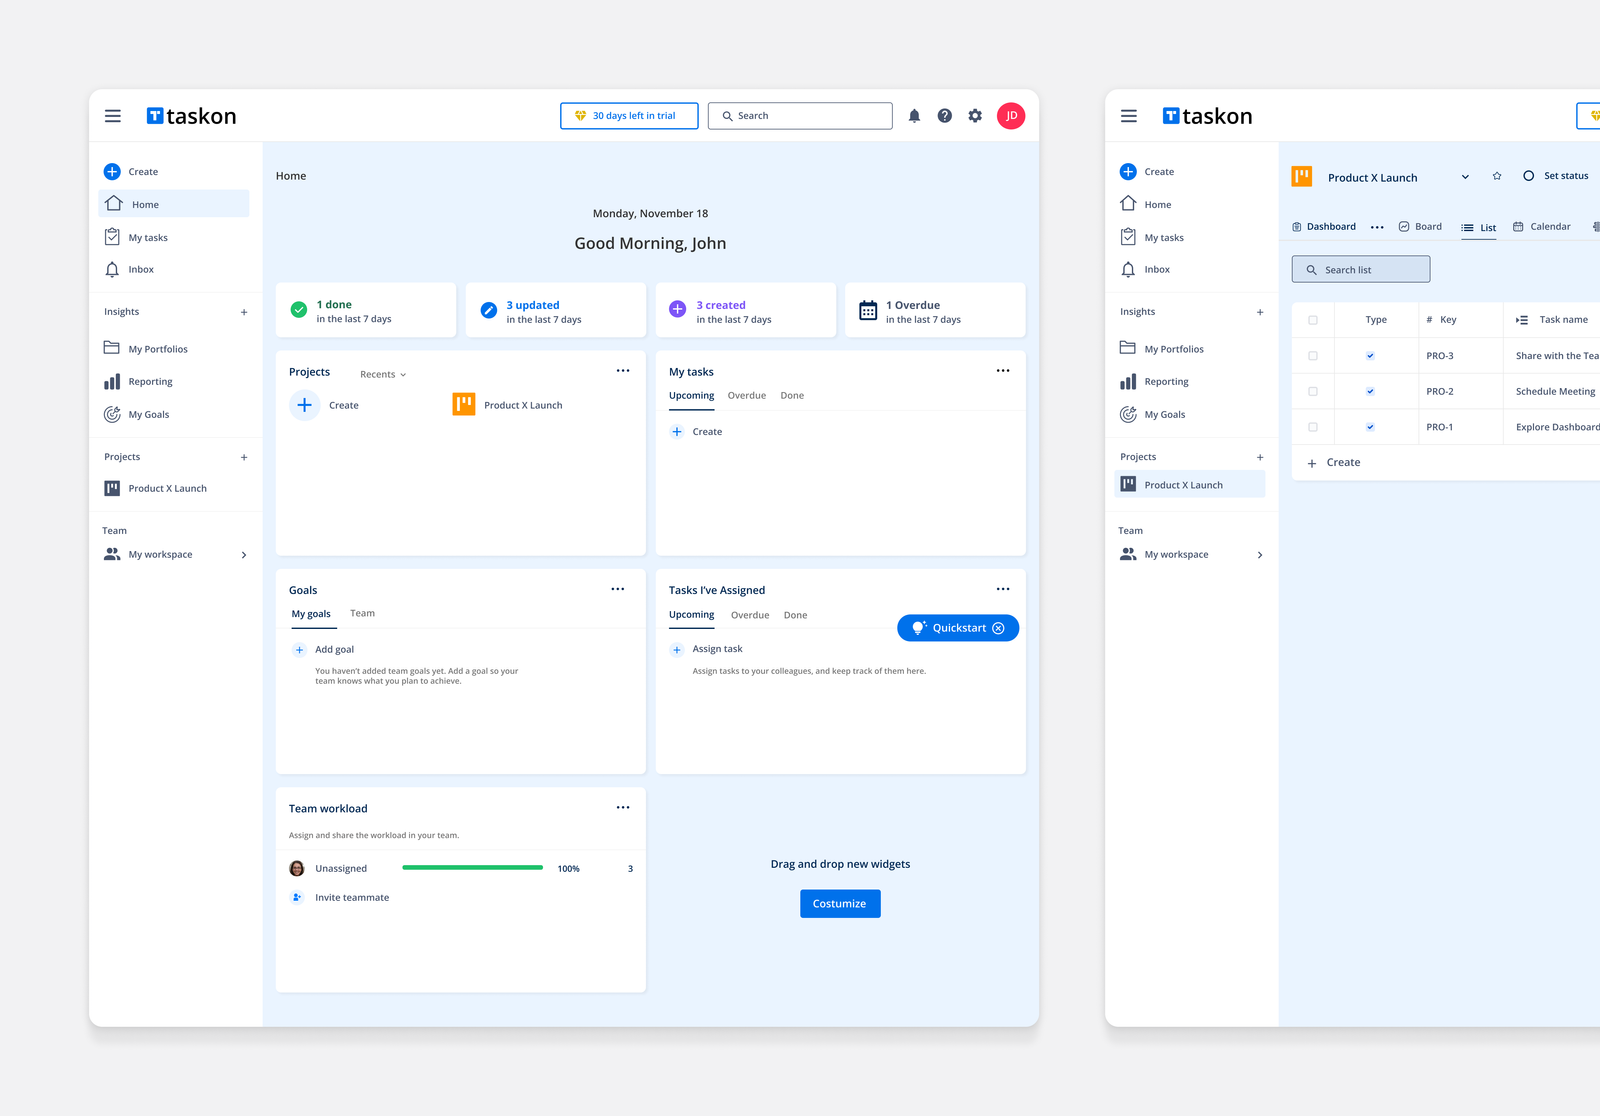
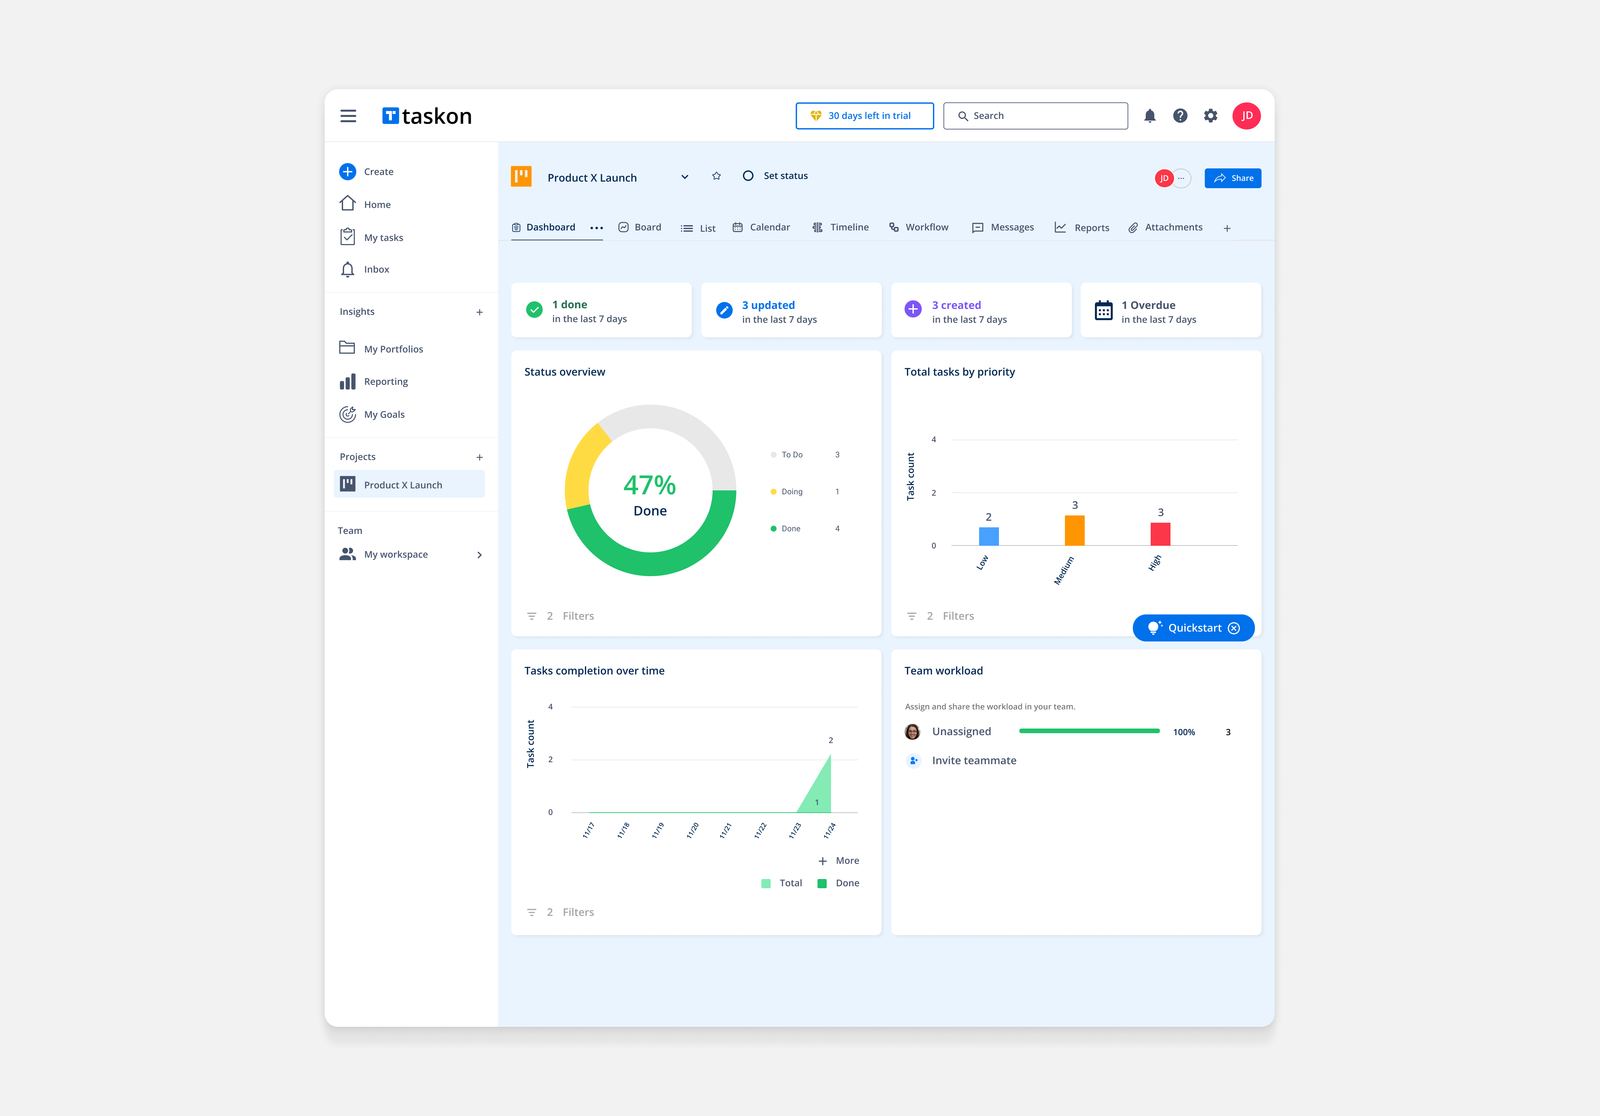
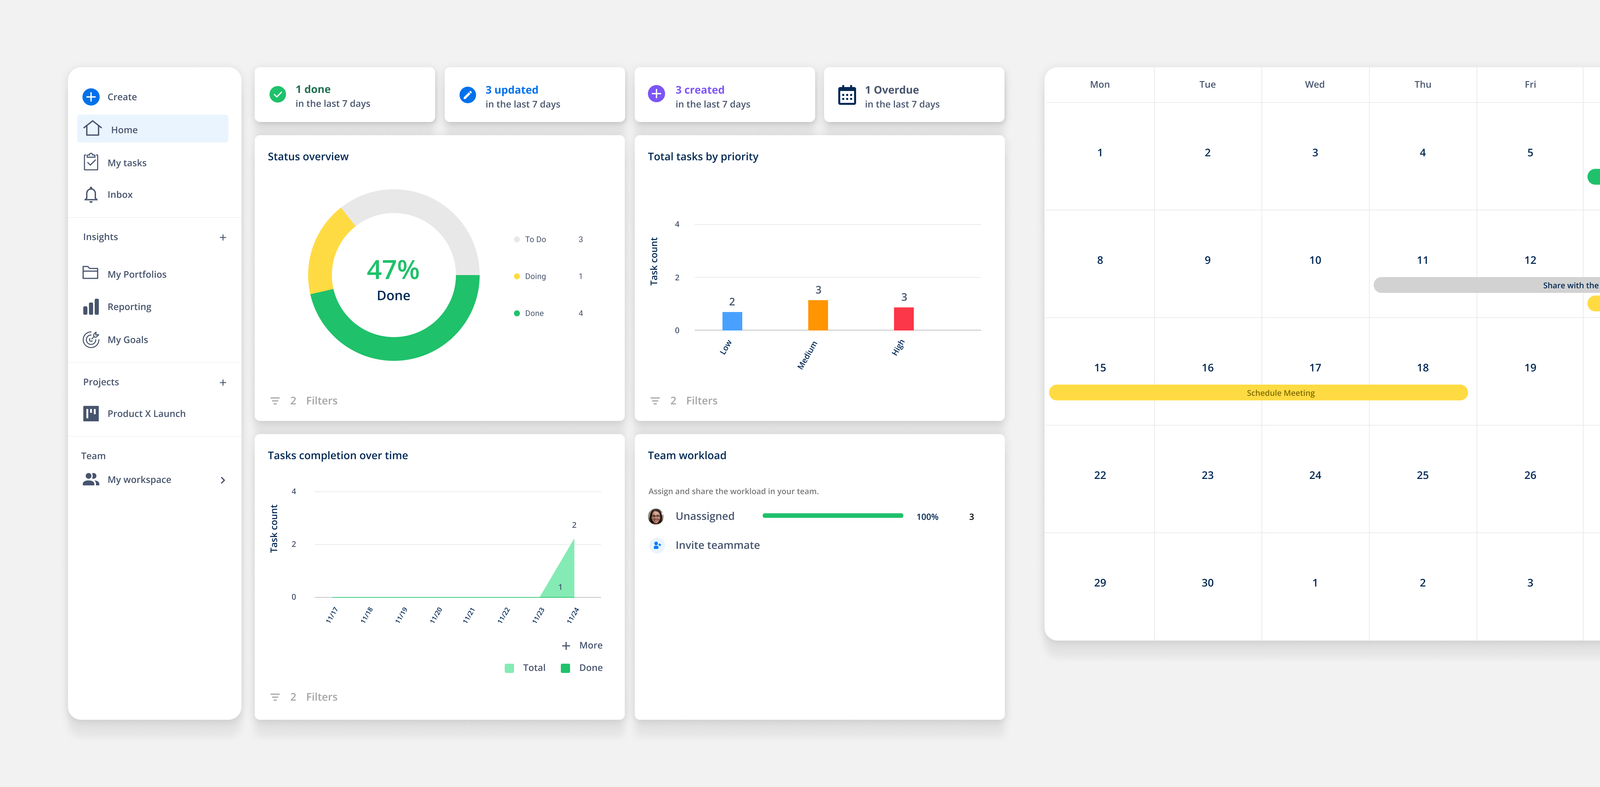
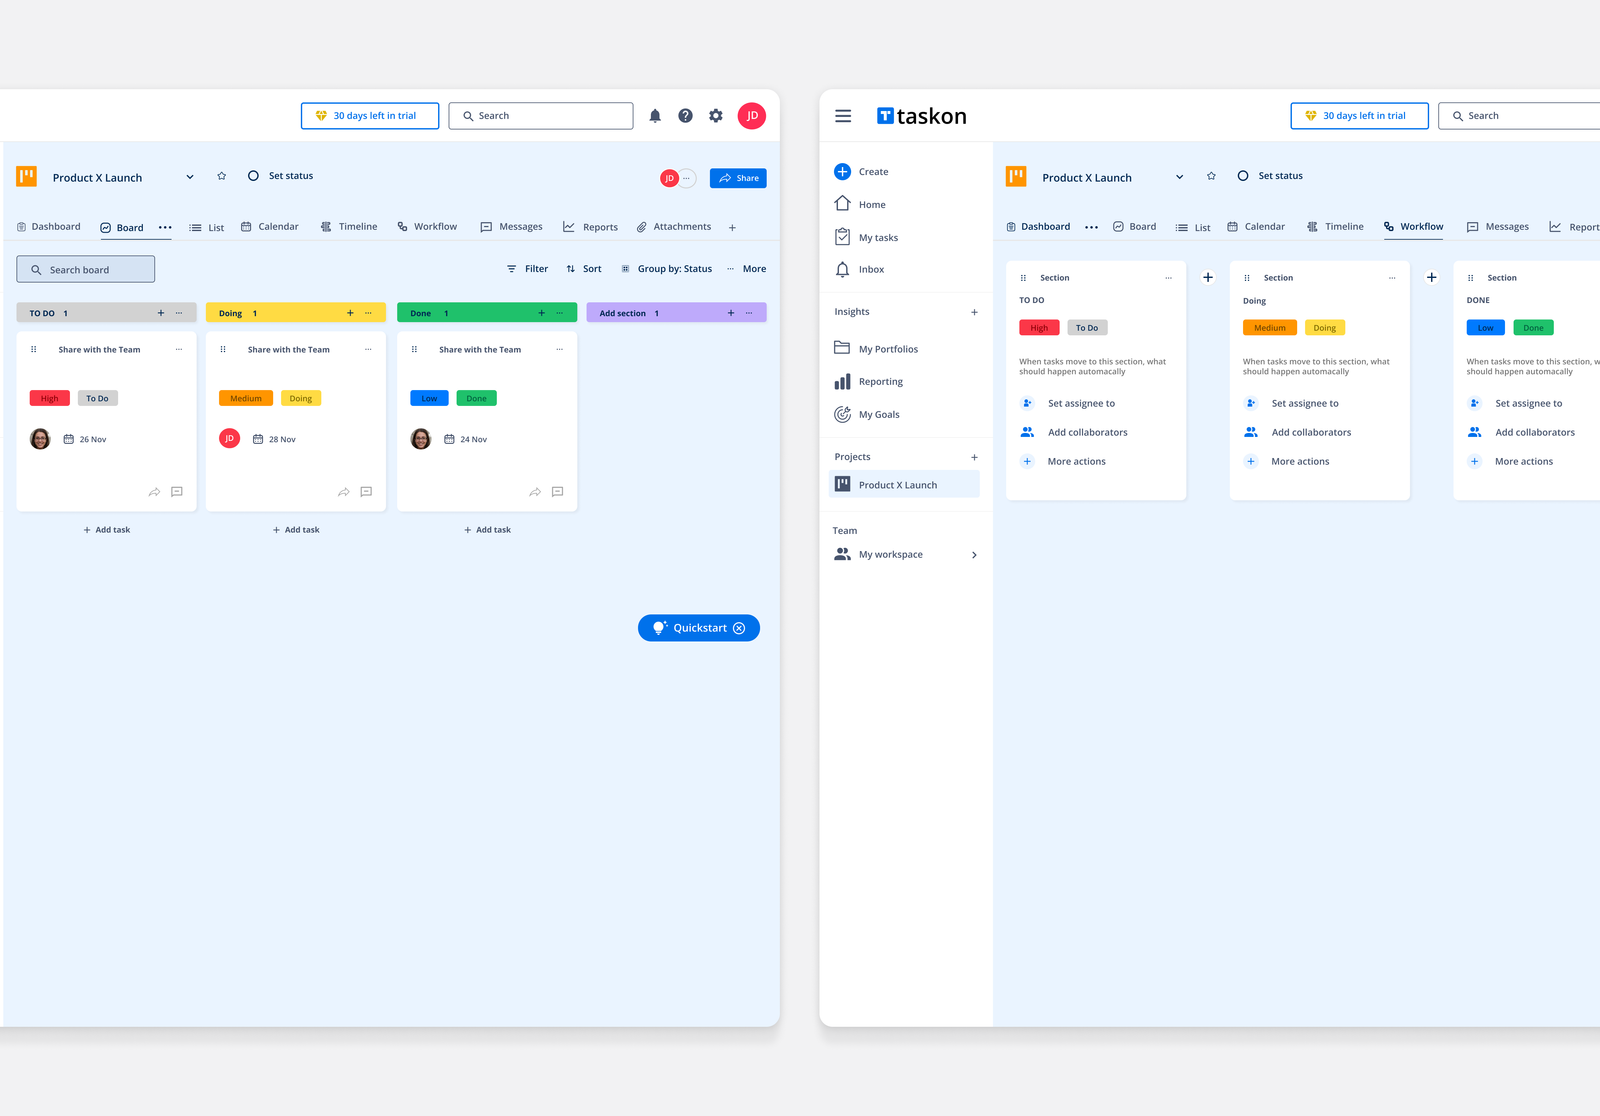
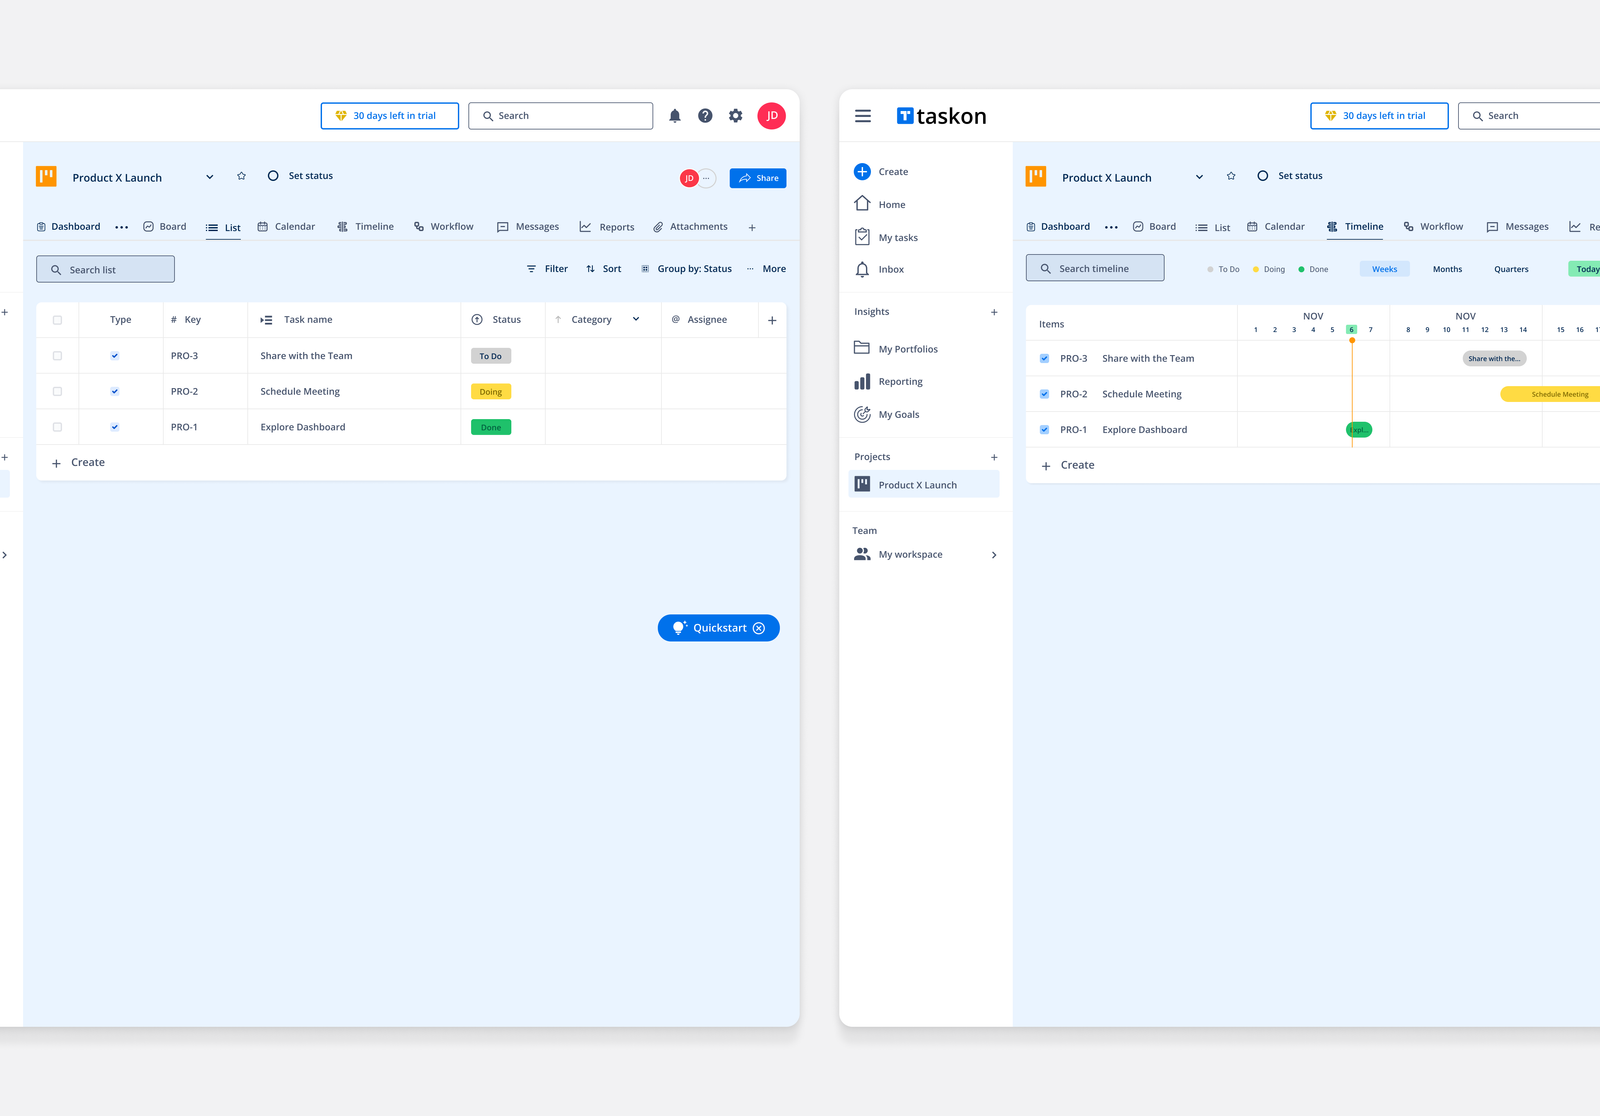
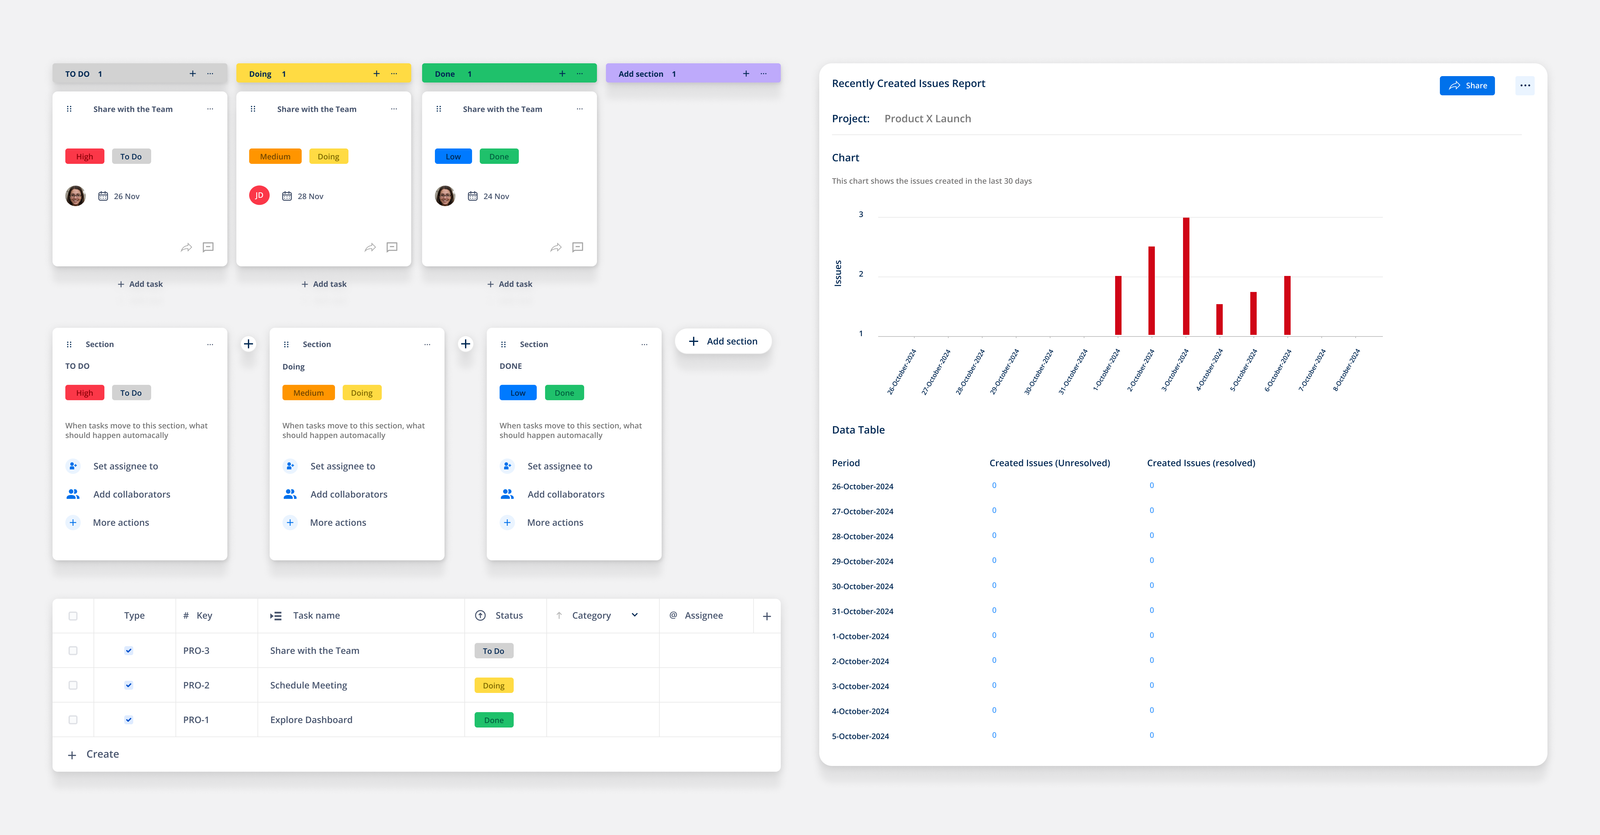
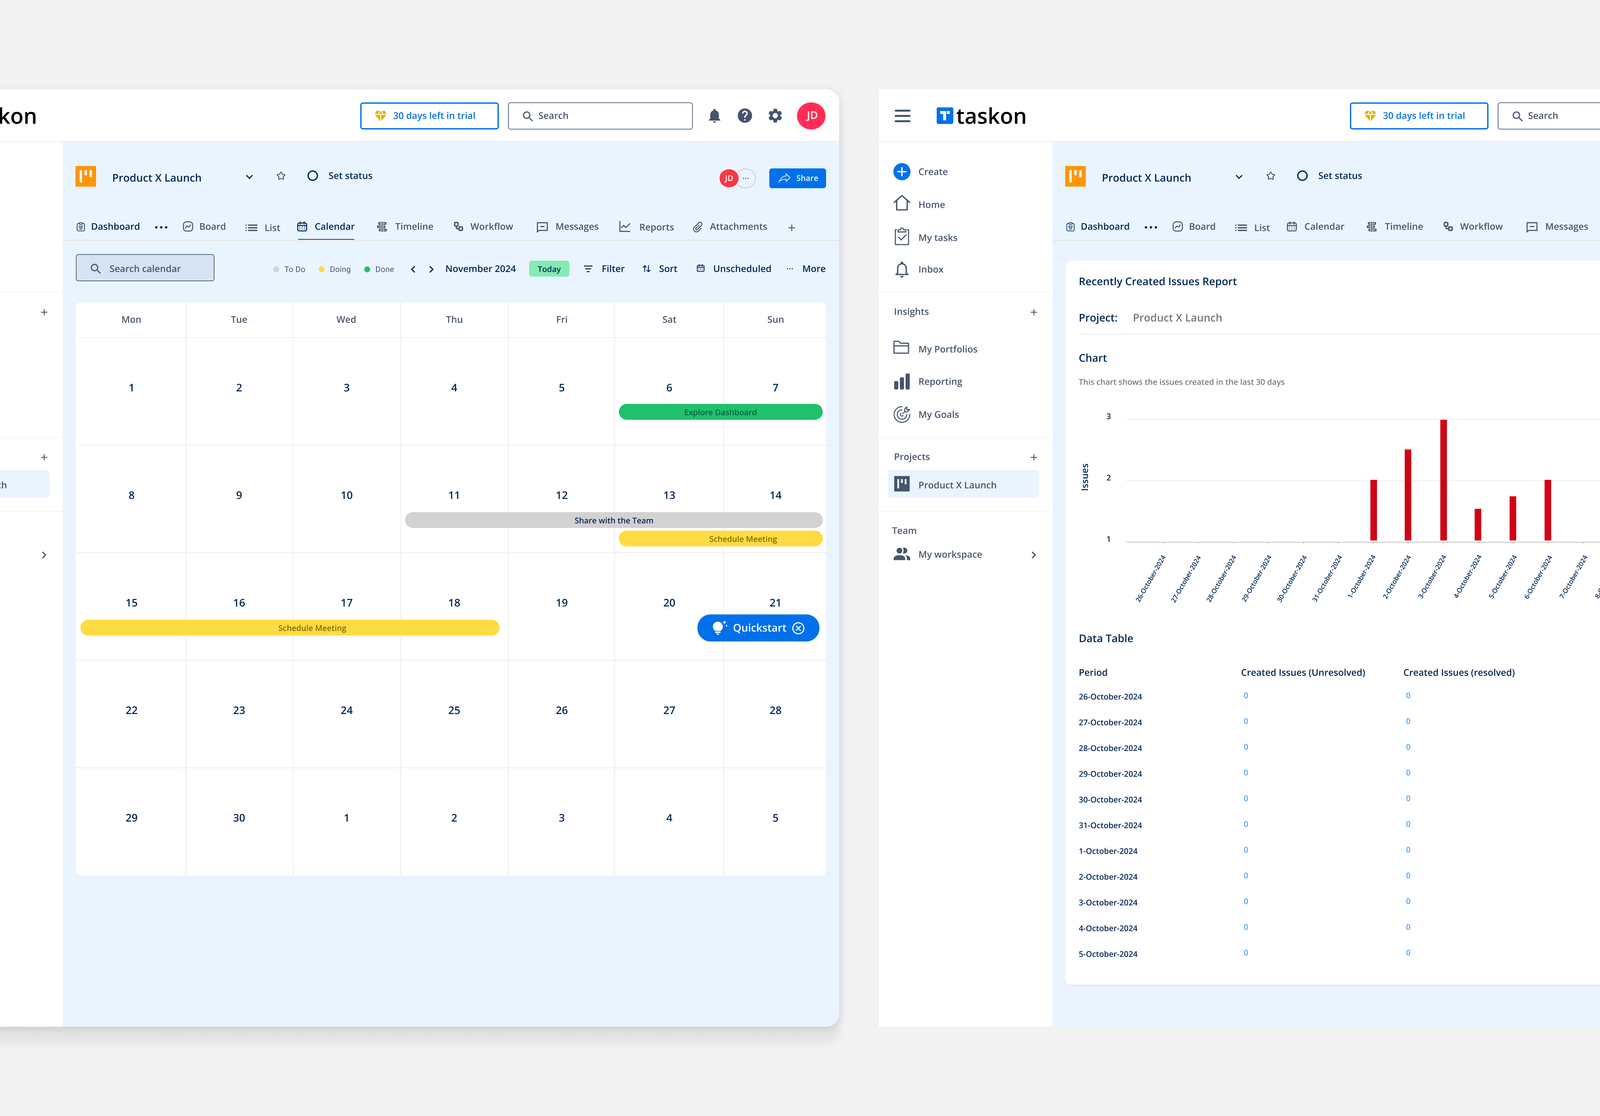
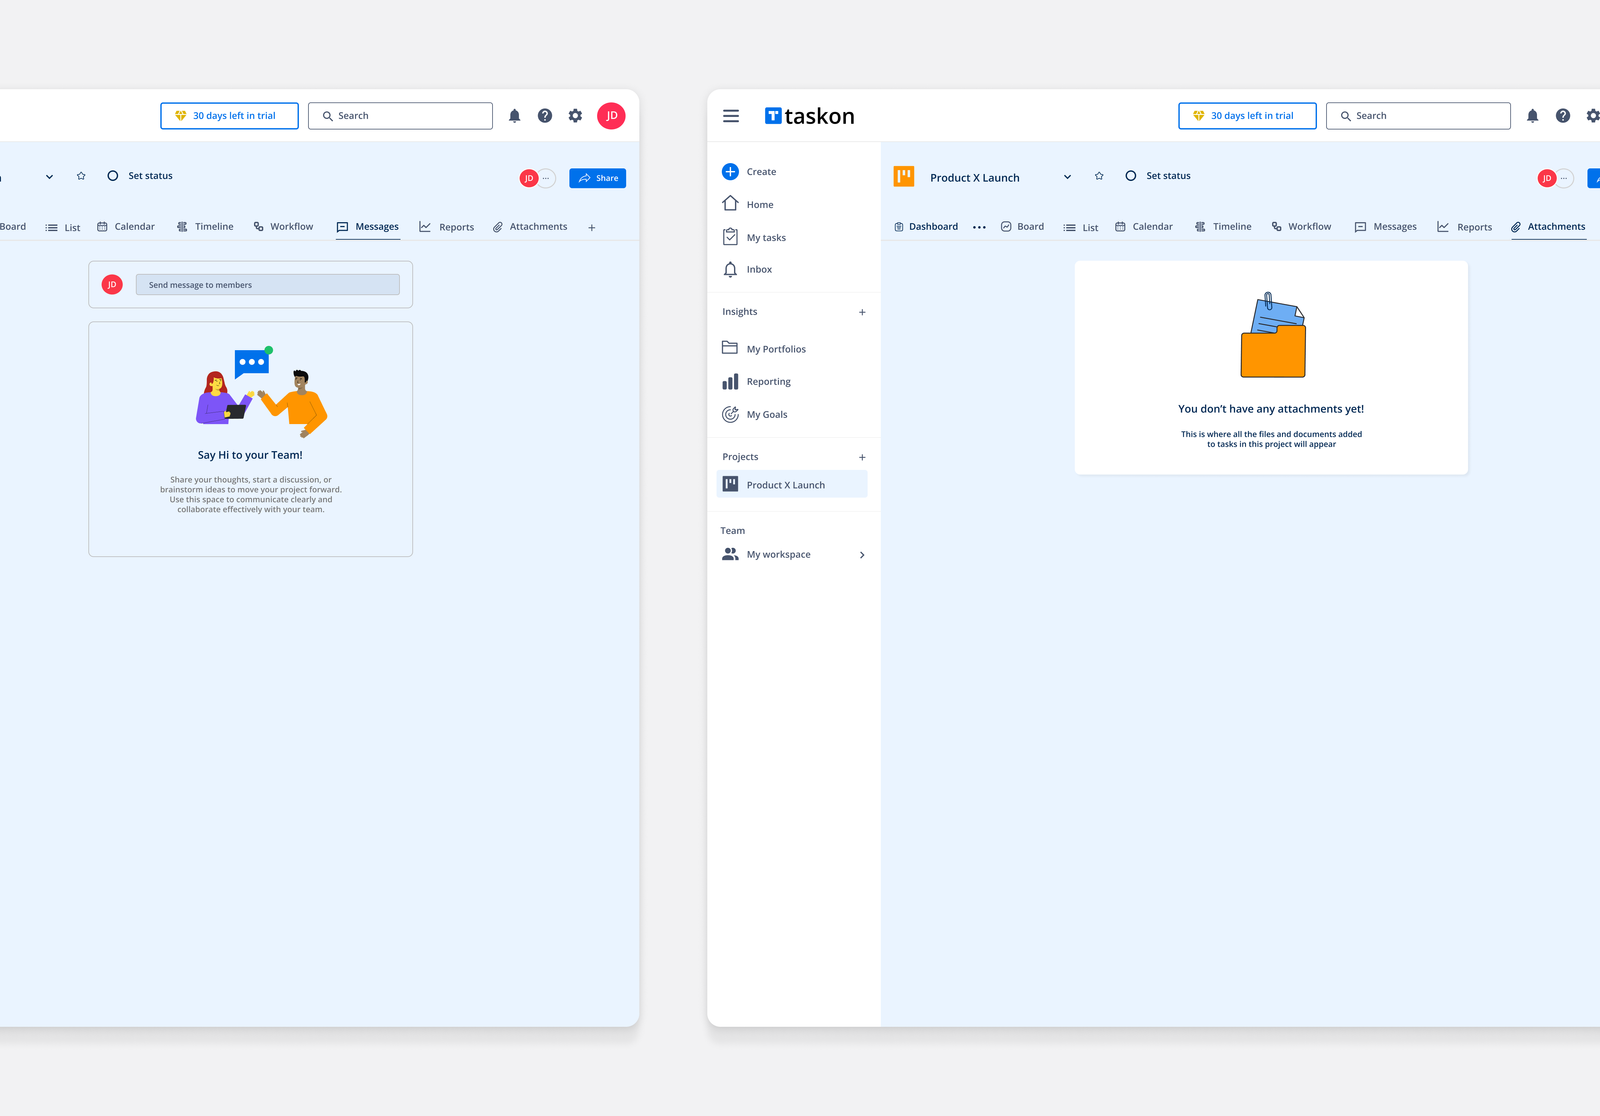
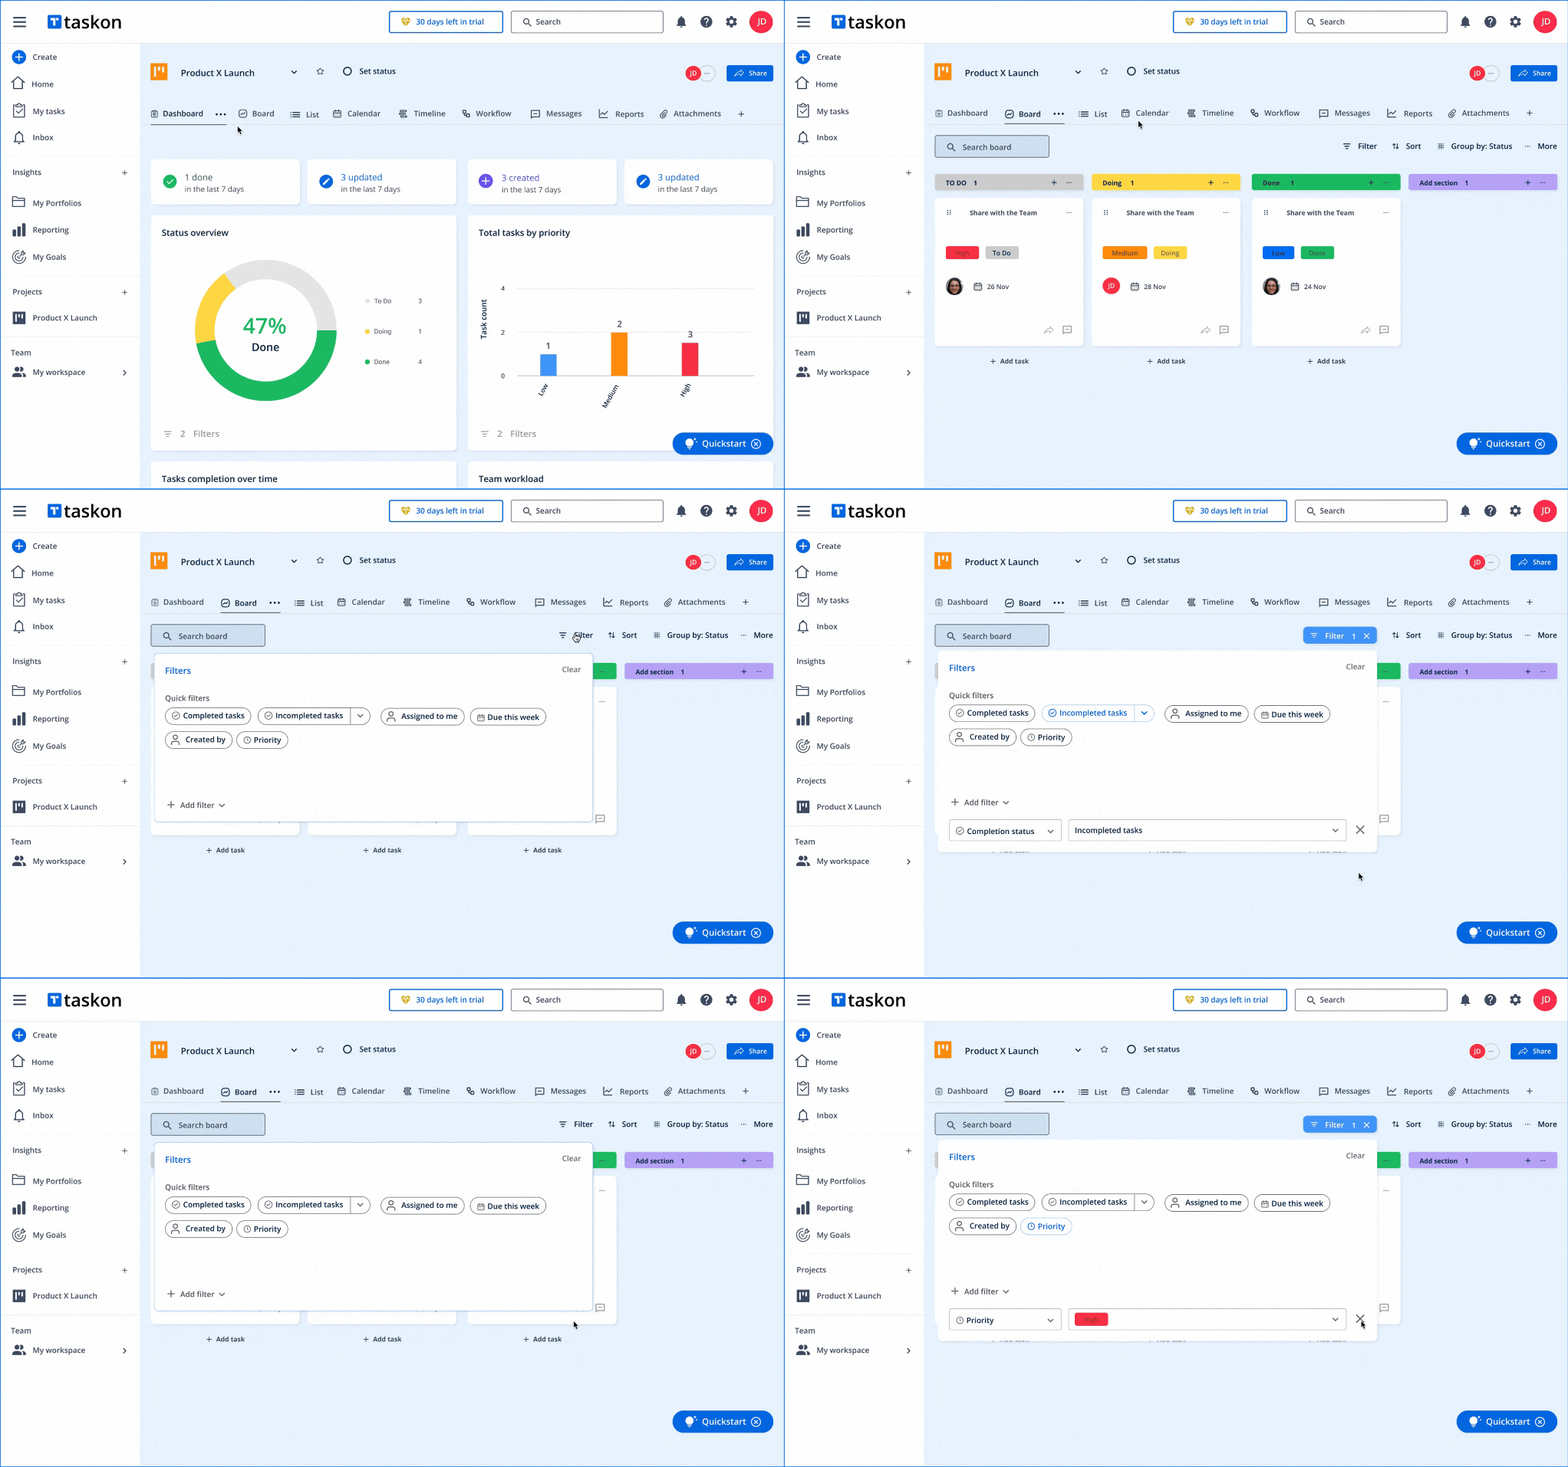
In this phase, the final product screens are executed by applying the Style Guide to the Wireframes. This process ensures the transformation of functional designs into visually polished interfaces. It provides stakeholders with a realistic view of the product’s end look and feel, enabling feedback and approval before proceeding to the development and implementation stage.
III – Prototype
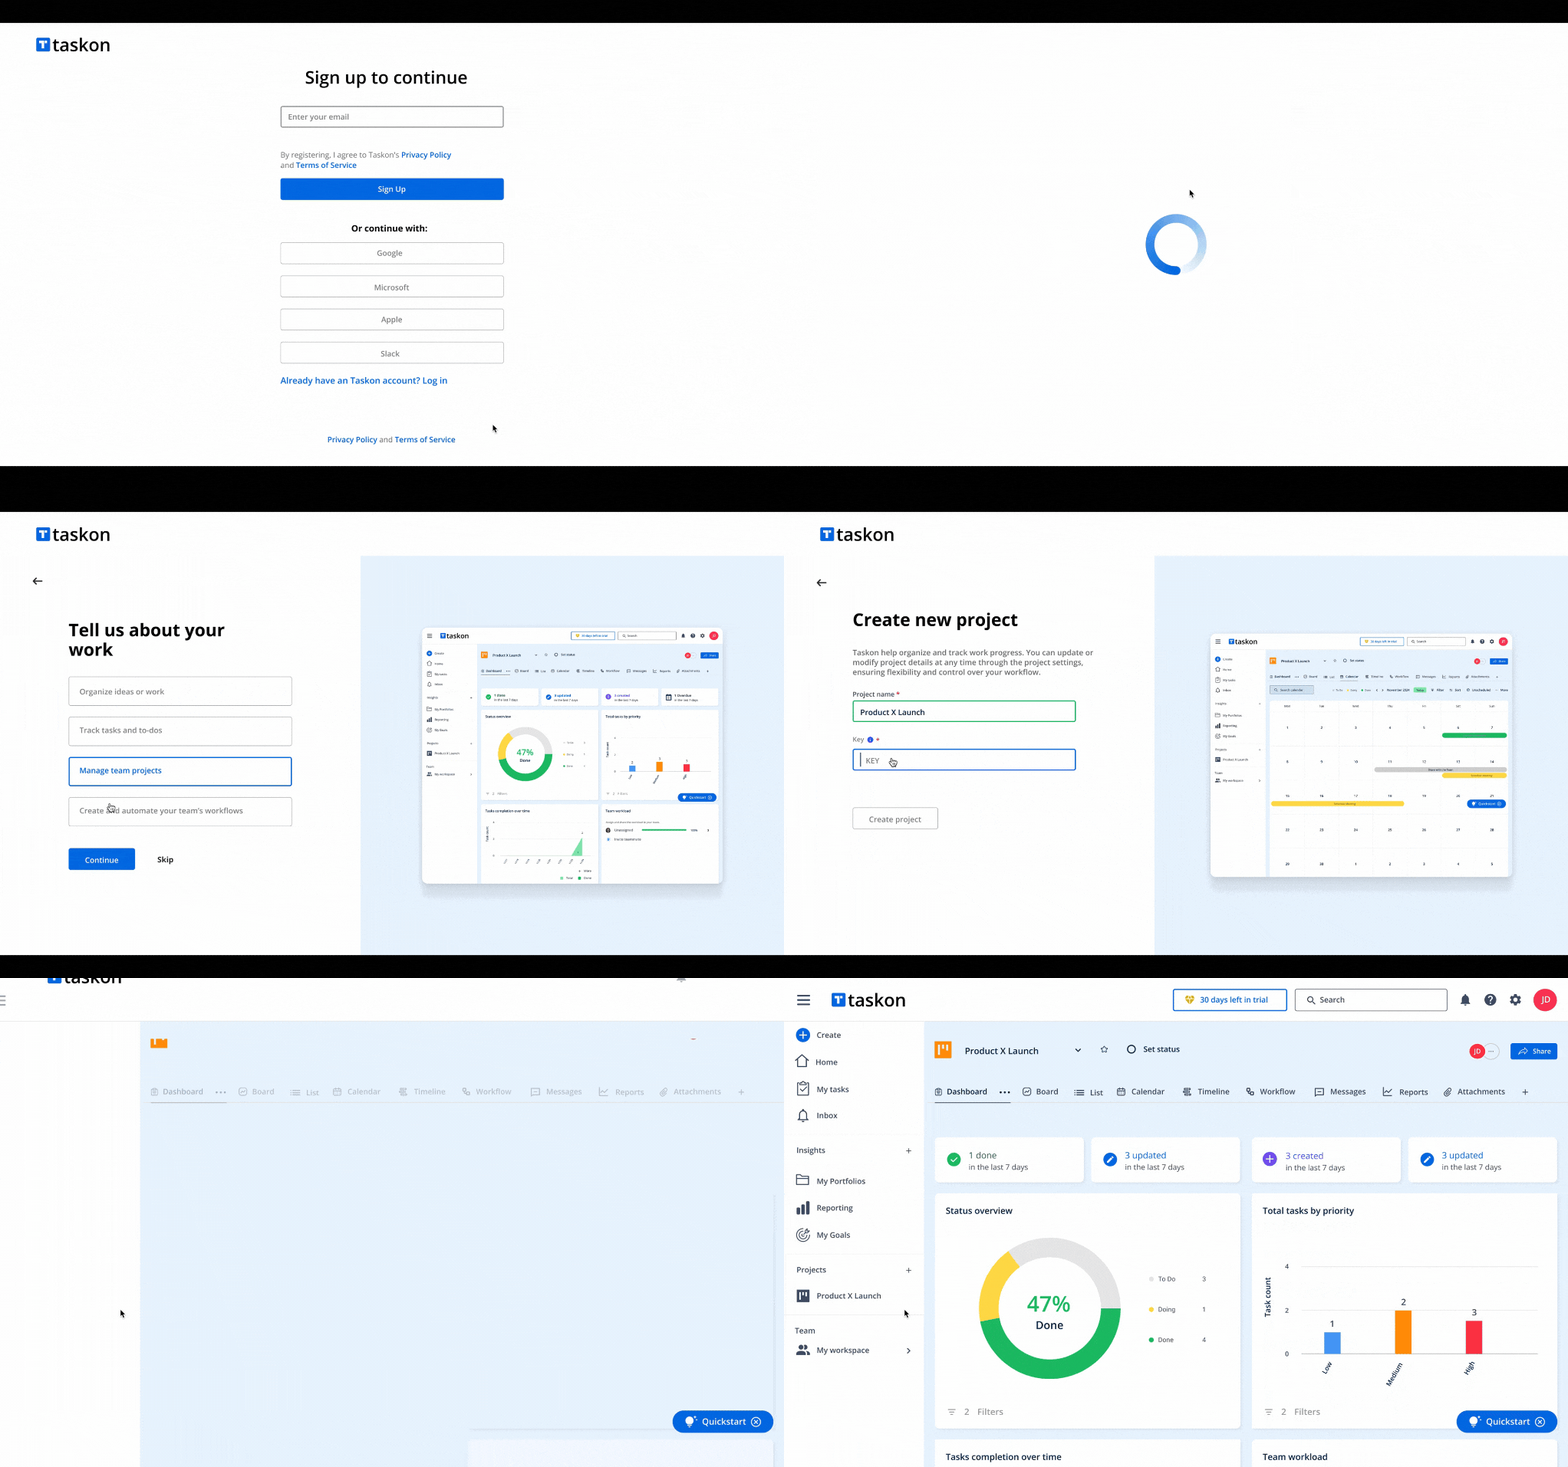
In this phase, a click-through prototype is created to simulate the product’s navigation and functionality. The prototype is accessible online and shareable via a secure link, enabling stakeholders, users, and investors to experience the interface and provide valuable feedback before development begins.
1- Onboarding Flow ( success Metric: the user completes onboarding within 5 minutes)
2- Navigation Flow ( success Metric: the user locates a task within 10 seconds)
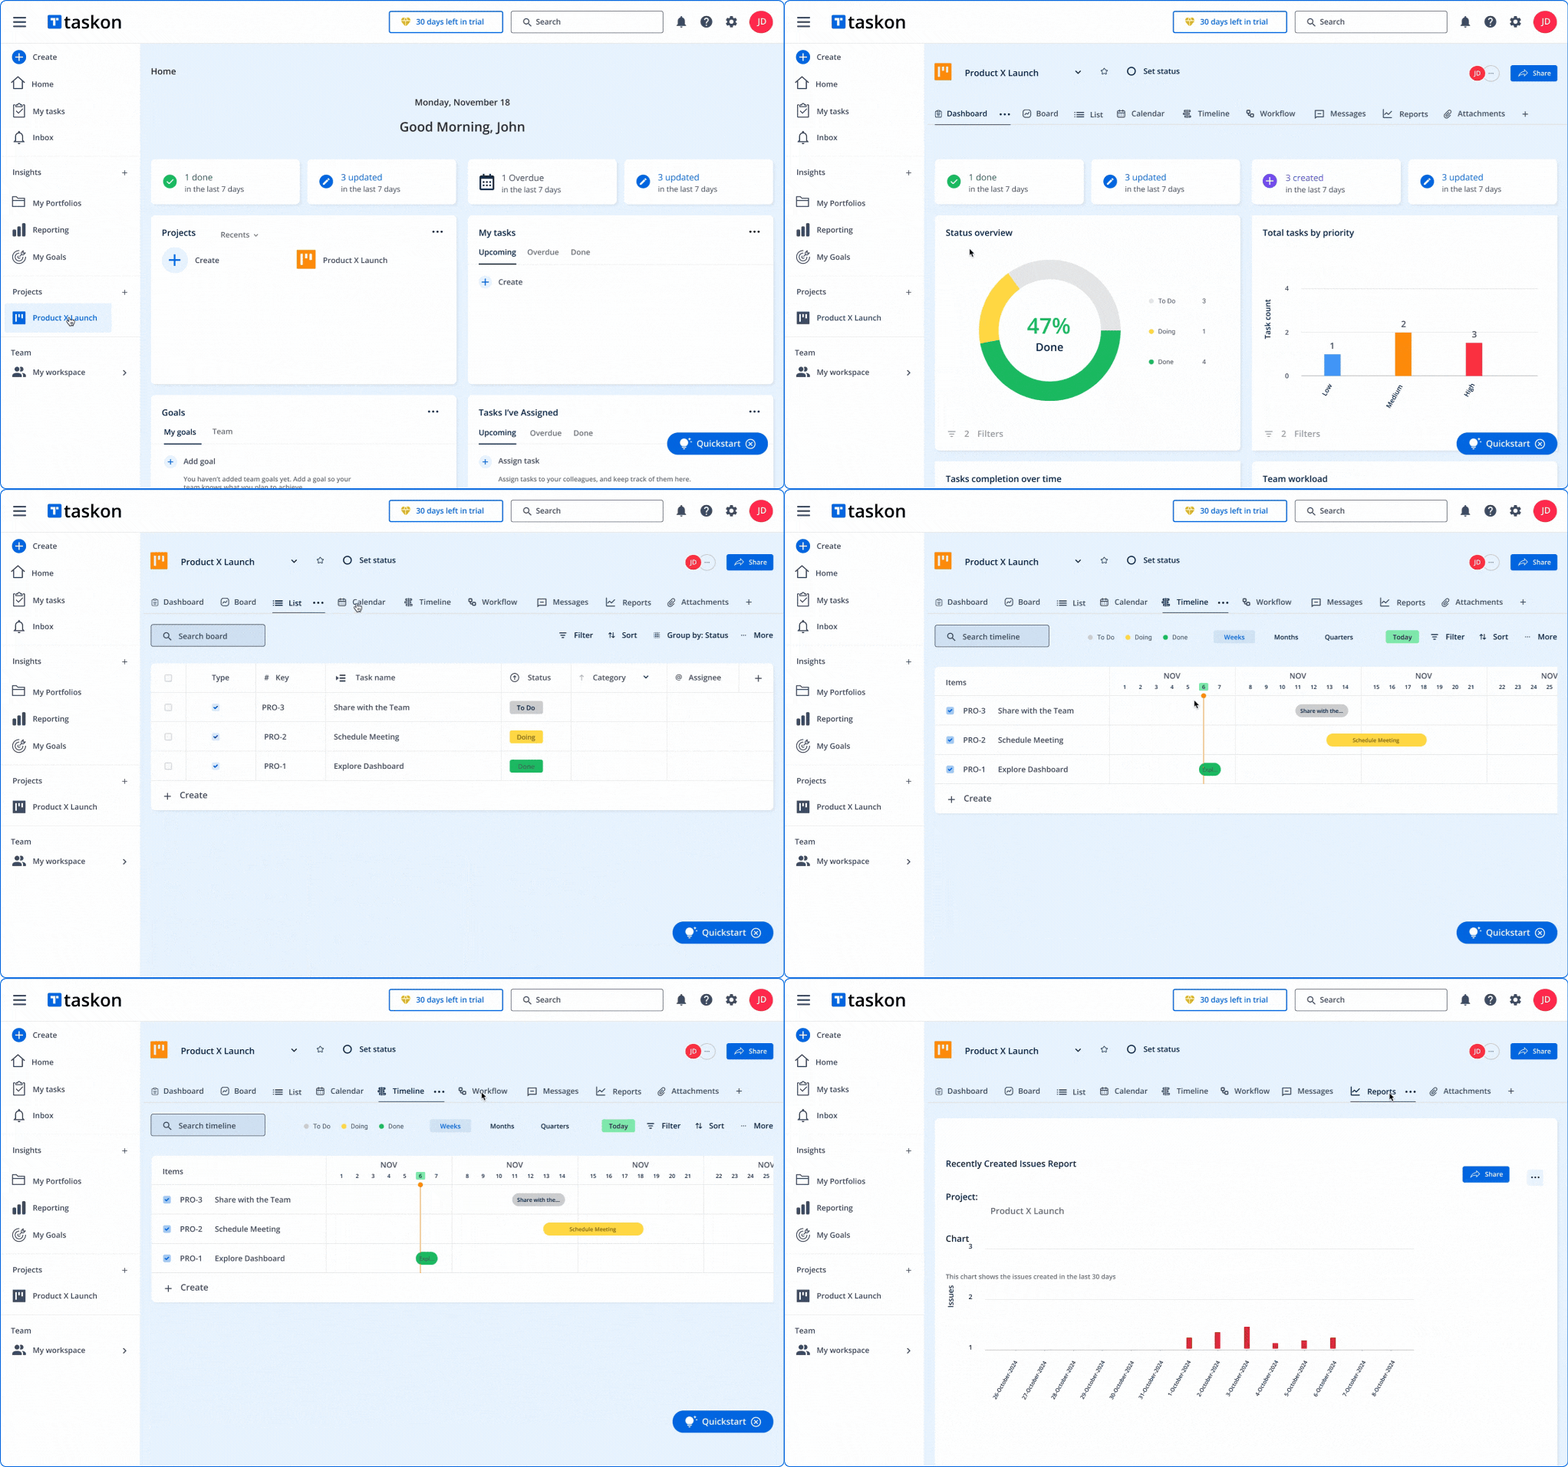
3- Reporting Flow (success Metric: the user generates and understands a report in under 2 minutes)
